Potential Reservoirs
Potential Reservoirs
MS-3 and MS-4 are considered the most important reservoir intervals in the NS14-1 Call area. There is no direct well calibration for MS-3 on the slope, but shelf wells indicate the sediment delivery systems were a complex mixture of clastics and carbonates corresponding to the Mic Mac Formation. Carbonates may have preferentially accumulated on the outer shelf during periods of high sea level with clastics preferentially delivery into deepwater during periods of falling and low sea level. The strong, continuous reflections within complex structures of the BSW in Parcels 1, 2, and 4 may correspond to impedance contrasts between carbonates and turbidite sands. It is also possible that some of the more continuous and commonly folded reflections within the BSW correspond to calci-clastic submarine fans shed from the mixed clastic-carbonate system located above the SGR. Secondary porosity development could make these favourable reservoirs. Calcite cementation and poor porosity preservation due to burial depth are key risk factors for potential reservoirs in MS-3.
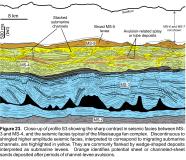
MS-4 is considered the most important reservoir interval, supplied by fluvial deltaic sands of the Missisauga Formation. Seismic facies in Parcels 1, 2, and 4 are consistent with the aggradation and migration of turbidite channels flanked by levees. We anticipate some lateral confinement of turbidite corridors on the upper slope, with reservoirs consisting primarily of amalgamated channels. Note that Tantallon M-41 likely missed the turbidite corridor in this proximal setting (Piper et al., 2010). We anticipate a progressive downslope decrease in confinement of turbidite corridors owing to avulsion of channel systems and deposition of unconfined sheet sands in submarine lobe or frontal splay settings. This trend has been documented in many modern analogues (e.g. Piper and Normark 2001; Deptuck et al., 2008), and is supported by direct observation from seismic profiles in the study area (Fig. 23). Because of the seaward shift in the shelf edge position from the base of MS-4 to the top, deeper intervals will be located further from the shelf edge. As such, there is increase potential for encountering less confined, more distal turbidite settings in the deeper parts of MS-4. There are also indications that subtle morphological variations were present on the slope in Parcels 1, 2, and 4 during deposition of the Missisauga fan complex. Future efforts should focus on identifying potential paleo-steps on the upper slope that may have led to more widespread sheet-like turbidite reservoirs in an upper slope position (see Deptuck et al., 2012 and references therein). 3D seismic volumes are required for such efforts.
Finally, turbidites of the Missisauga fan complex were probably also deposited in the SWLS. Trapping of sands on this part of the slope was probably quite efficient owing to the increased complexity of the slope morphology and corresponding increased potential for ponding of turbidites. Improved seismic imaging in this very complex salt tectonic setting is needed to better define turbidite corridors through the SWLS. Modern seismic data may also help discriminate between high and low porosity sands as well as gas charged sands. For example, Goodway et al. (2008) described the results of an Amplitude Variation with Offset (AVO) and Lambda-Mu-Rho (LMR) analysis conducted over the Stonehouse exploration license held by Encana from Jan, 1, 2002 to Dec. 31, 2007. AVO analysis can be used to detect anomalies due to highly porous hydrocarbon filled reservoirs, while LMR inversion can provide information about the rock properties of potential reservoirs. Modeled data based on the Annapolis G-24 and Tantallon M-41 wells predicts that high porosity gas sands thicker than 10 m will produce bright AVO responses that are clearly distinguishable from high porosity wet sands or low porosity wet or gas sands (Goodway et al., 2008). The study also points to a significant number of positive Upper Missisauga AVO anomalies within the northern portion of Parcel 2.


