


Parcel 2 Exploration Potential
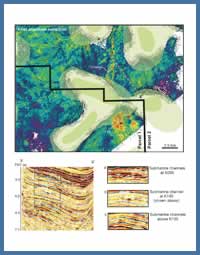
Figure 21
Amplitude extraction from the K140 marker showing an Aptian(?) submarine channel system (on the eastern flank of the Big Thrum prospect - Parcel 2) and corresponding submarine fan deposited above a local step on the middle to lower slope (northern part of the Crows Neck prospect - Parcel 1). A representative seismic profile across the eastern flank of the 'Big Thrum' prospect (line X-X') shows the development of submarine channels at several stratigraphic levels in Lower Cretaceous strata.
Amplitude extraction from the K140 marker showing an Aptian(?) submarine channel system (on the eastern flank of the Big Thrum prospect - Parcel 2) and corresponding submarine fan deposited above a local step on the middle to lower slope (northern part of the Crows Neck prospect - Parcel 1). A representative seismic profile across the eastern flank of the 'Big Thrum' prospect (line X-X') shows the development of submarine channels at several stratigraphic levels in Lower Cretaceous strata.
A large 3D seismic volume (4530 km2) acquired by Shell in the summer of 2000 (Program #NS24-S06-01E) and 2001 (Program #NS24-S06-02E) covers about two-thirds of Parcel 2 and was used to identify several promising structures (Figure 22). Apparent structural closure exists in both the time and depth domains at several stratigraphic levels within interpreted Missisauga to lower Logan Canyon equivalent deepwater strata (for depth conversion approach, see Shell, 2002; Program NS24-S006-001E/2E). As in Parcel 1, most traps are either 3-way closures against salt flanks, subsalt, or fault welds, or are associated with folds that require closure of some sort on the flanks of salt, below salt, or along a fault weld (Figure 23). Most structures appear to have been in place by the Late Cretaceous, but were variably modified during a younger period of contraction that was accommodated mostly within isolated salt diapirs (strata were folded above diapirs, but underlying structures were commonly deformed to a much lesser extent). Additional structures with potential closure probably exist in areas with sparser 2D seismic coverage in the southern parts of Parcel 2.
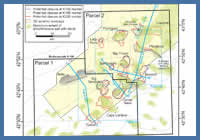
Figure 22 a
Blob map showing the outlines of potential structural closures identified in 3D seismic at the K230, K195, and K140 seismic markers in Parcels 1 and 2. Where possible, the closure areas were constrained using the C5, C10, and C30 structure maps presented in Shell (2002). Note that the velocity model for depth converted structural maps presented in Shell's 'Thrumcap Survey Geophysical Review' (CNSOPB Program NS24-S006-001E/2E), were based on stacking velocities of the sediment layers and water column, but because of anomalous results produced by salt diapirs and salt sheets, a salt layer was not included in the model. A key uncertainty therefore is the effect the isolated salt diapirs and salt sheets/tongues have on the structures described above. Also shown are figure locations, the outline of the Thrumcap 3D seismic volume, and the maximum extent of allochthonous salt and inferred salt stocks.
Blob map showing the outlines of potential structural closures identified in 3D seismic at the K230, K195, and K140 seismic markers in Parcels 1 and 2. Where possible, the closure areas were constrained using the C5, C10, and C30 structure maps presented in Shell (2002). Note that the velocity model for depth converted structural maps presented in Shell's 'Thrumcap Survey Geophysical Review' (CNSOPB Program NS24-S006-001E/2E), were based on stacking velocities of the sediment layers and water column, but because of anomalous results produced by salt diapirs and salt sheets, a salt layer was not included in the model. A key uncertainty therefore is the effect the isolated salt diapirs and salt sheets/tongues have on the structures described above. Also shown are figure locations, the outline of the Thrumcap 3D seismic volume, and the maximum extent of allochthonous salt and inferred salt stocks.
As in Parcel 1, subregional depositional models and seismic stratigraphic studies imply that reservoirs in Parcel 2 consist of Lower Cretaceous turbidite sands deposited as sheets or channeled sheets above areas of reduced gradient in an interpreted middle to lower slope setting (e.g. Figure 21). Sand-rich deltas on the paleo-shelf areas of the western Sable Subbasin are interpreted to have supplied sands via sediment gravity flows through canyons that eroded the outer shelf and upper slope (Figures 11, 12, 18, 19). Sidewall cores from Newburn H-23 in the K230 to K140 interval provide strong evidence for coarse grained channel lags as well as fine-grained turbidites deposited in overbank settings (i.e. on the levees of submarine channels). This may indicate that the well is positioned in an upper to middle slope setting dominated by bypassing sediment gravity flows. Seismic facies interpretations in the Newburn area are tenuous, but seismic imaging improves significantly in the areas of Parcels 1 and 2 where there is evidence for lens-shaped deposits interpreted as sand-prone submarine lobes (e.g. Figure 23) locally eroded by submarine channels (e.g. Figure 21).
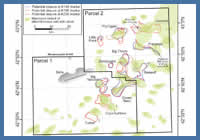
Figure 22 b
Same blob map presented in (a) but without bathymetric contours, 3D seismic coverage, and figure locations.
Same blob map presented in (a) but without bathymetric contours, 3D seismic coverage, and figure locations.
Seals are provided by marine shales that separate turbidite sands, combined with a thick interval of shale-dominated Logan Canyon equivalent strata that drapes most of the structures. Based on the gas bearing sands encountered in Newburn H-23 (and several other deepwater wells on the Scotian slope - Kidston et al., 2007), the hydrocarbon type is inferred to be gas generated from Verrill Canyon shales Mukhopadhyay (2006). There may also be potential for oil generating source rocks in Mohican equivalent deeper water strata (e.g. the J350 to J280 interval corresponding to the first minibasins to load autochthonous salt – Figure 10), or even older Eurydice equivalent synrift lacustrine deposits (e.g. autochthonous salt is commonly underlain by a mixed amplitude interval interpreted to correspond to synrift clastics or bedded salt deposited in grabens and half-grabens – Figure 15).
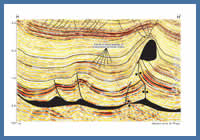
Figure 23
Profile H to H' showing the key structure types in the areas of Parcels 1 and 2. Most traps are either 3-way closures against salt flanks, subsalt, or fault welds, or are associated with folds that require closure of some sort on the flanks of salt, below salt, or along a fault weld. Note the seismic facies character between the K230 and K140 markers, consisting of interfingering of seismic loops with subtle baselap-onlap relationships interpreted as compensationally stacked sand-prone turbidite lobes. See Figure 22a for location.
Profile H to H' showing the key structure types in the areas of Parcels 1 and 2. Most traps are either 3-way closures against salt flanks, subsalt, or fault welds, or are associated with folds that require closure of some sort on the flanks of salt, below salt, or along a fault weld. Note the seismic facies character between the K230 and K140 markers, consisting of interfingering of seismic loops with subtle baselap-onlap relationships interpreted as compensationally stacked sand-prone turbidite lobes. See Figure 22a for location.
Structures on Parcel 2
The Big Thrum structure is located in water depths of around 2550 m. It is a complex contractional fold with salt diapirs to the north and south. The western side of the structure is flanked by a landward-vergent thrust fault that offsets strata below the K230 seismic marker, and appears to detach above autochthonous salt or its associated weld (Figure 30). The fold axis is oriented N-S and its crest is located between 7000 m TVD-ss (at the C5/K230 marker) and 5700 m TVD-ss (at the C30/K140 marker) (see Shell, 2002; Program NS24-S006-001E/2E). Structural closure requires trapping against salt (either by direct subsalt contact or stratigraphic pinchout onto salt flanks). Big Thrum consists of two main compartments, one to the west and one to the east, separated by a series of crestal faults across which there are wide variations in amplitude in age-equivalent strata (Figure 29). The eastern compartment is the largest and is characterized by an inverted succession of variable amplitude seismic reflections interpreted as channeled turbidite sheet sands that originally filled a negative-relief minibasin (Figure 30). Seismic markers between K230 and K140 terminate with a direct subsalt contact against the base of the northern salt diapir. Seismic markers terminate via a combination of stratigraphic thinning onto salt flanks and direct subsalt contact along the southern diapir. Closure areas are estimated to range from 20 to 40 km2 at multiple stratigraphic levels. Using a minimum area of 20 km2 and a maximum potential area of 40 km2 (with a most likely area (P50) of 30 km2), and assuming net pay thicknesses that range from one 20 m turbidite sand to four 30 m turbidite sands (net pay of 120 m), with average porosities ranging from 12 to 20%, we estimate that the main part of Big Thrum has 1.65 Tcf (P90) to 4.68 Tcf (P10) of in-place gas, with a mean of more than 3 Tcf (calculated using @Risk probability analysis software). Faulting along the crest of the Big Thrum fold provides additional potential for closure on the western flank of the structure (in a separate ~15 km2 compartment) associated with up-dip fault seal of turbidite reservoirs juxtaposed against marine shale. Total closure area, thus, could be as large as 55 km2. Using this value for the maximum closure area yields a total in-place gas potential of over 3.8 Tcf (mean).
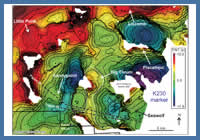
Figure 28
Time-structure map of the K230 marker in Parcel 2, showing the Big Thrum, Sandypoint, and Piscatiqui structures. Refer to text for discussion and Figure 22a for location.
Time-structure map of the K230 marker in Parcel 2, showing the Big Thrum, Sandypoint, and Piscatiqui structures. Refer to text for discussion and Figure 22a for location.
Further east, the Seawolf structure (Figures 28, 29) is a potential Big Thrum look-alike, but it is located at the edge of 3D seismic coverage so its total extent is uncertain. It contains some anomalously high amplitude reflections along its faulted crest. Sandypoint, located west of Big Thrum, is a fold with 4 to 6 km2 of 4-way dip closure at multiple stratigraphic levels (Figure 29). The fold is overprinted by crestal faults, and although it is relatively small, it could form a nice satellite opportunity if discoveries are made on adjacent structures. Several additional structures are present in the northern portion of Parcel 2. Both Liscomb and Piscatiqui (Figure 22) are E-W oriented structures that developed during counter-regional rotation and contraction of a chain of minibasins during sediment loading and expulsion of salt (Figure 31). In the east, Liscomb forms a 3-way subsalt closure against a squeezed allochthonous salt tongue. It passes to the west into a fold, where a potential gas chimney has been identified, consisting of very bright anomalous amplitudes (see Figure 32). Similarly, a potential direct hydrocarbon indicator (DHI) exists in the lower fill of a Pliocene canyon where the floor of the canyon was folded above a squeezed salt diapir, forming a shallow trap above the eastern part of the Piscatiqui structure. Both Liscomb and Piscatiqui underlie allochthonous salt, and depth conversions will alter the extent and shape of structural closure. Little Punk and Fryingpan are folds above what appear to be basement highs associated with rift blocks. Each structure is flanked to the north by a landward-vergent reverse fault, and Fryingpan requires closure against allochthonous salt.
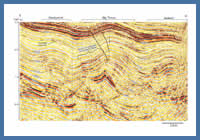
Figure 29
Seismic profile K to K' crossing the Sandypoint, Big Thrum, and Seawolf structures in Parcel 2. Note the variation in amplitudes across the crestal fault of the Big Thrum structure. See Figures 22a and 28 for location.
Seismic profile K to K' crossing the Sandypoint, Big Thrum, and Seawolf structures in Parcel 2. Note the variation in amplitudes across the crestal fault of the Big Thrum structure. See Figures 22a and 28 for location.
Figure Captions
Figure 21. Amplitude extraction from the K140 marker showing an Aptian(?) submarine channel system (on the eastern flank of the Big Thrum prospect – Parcel 2) and corresponding submarine fan deposited above a local step on the middle to lower slope (northern part of the Crows Neck prospect – Parcel 1). A representative seismic profile across the eastern flank of the ‘Big Thrum’ prospect (line X-X’) shows the development of submarine channels at several stratigraphic levels in Lower Cretaceous strata.
Figure 22. a) Blob map showing the outlines of potential structural closures identified in 3D seismic at the K230, K195, and K140 seismic markers in Parcels 1 and 2. Where possible, the closure areas were constrained using the C5, C10, and C30 structure maps presented in Shell (2002). Note that the velocity model for depth converted structural maps presented in Shell’s ‘Thrumcap Survey Geophysical Review’ (CNSOPB Program NS24-S006-001E/2E), were based on stacking velocities of the sediment layers and water column, but because of anomalous results produced by salt diapirs and salt sheets, a salt layer was not included in the model. A key uncertainty therefore is the effect the isolated salt diapirs and salt sheets/tongues have on the structures described above. Also shown are figure locations, the outline of the Thrumcap 3D seismic volume, and the maximum extent of allochthonous salt and inferred salt stocks. b) Same blob map presented in (a) but without bathymetric contours, 3D seismic coverage, and figure locations.
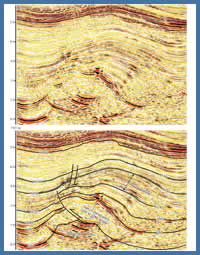
Figure 30
Uninterpreted and interpreted profiles showing a close-up of the Big Thrum structure in Parcel 2. Note the inverted thick between the K230 and K195 markers, interpreted to correspond to turbidite sand deposits in a negative relief minibasin prior to folding. There is also evidence for submarine channels (c) at multiple stratigraphic levels, indicating that Big Thrum was positioned along an active turbidite corridor during the Early Cretaceous. See Figure 28 for location, and text for discussion.
Uninterpreted and interpreted profiles showing a close-up of the Big Thrum structure in Parcel 2. Note the inverted thick between the K230 and K195 markers, interpreted to correspond to turbidite sand deposits in a negative relief minibasin prior to folding. There is also evidence for submarine channels (c) at multiple stratigraphic levels, indicating that Big Thrum was positioned along an active turbidite corridor during the Early Cretaceous. See Figure 28 for location, and text for discussion.
Figure 23. Profile H to H’ showing the key structure types in the areas of Parcels 1 and 2. Most traps are either 3-way closures against salt flanks, subsalt, or fault welds, or are associated with folds that require closure of some sort on the flanks of salt, below salt, or along a fault weld. Note the seismic facies character between the K230 and K140 markers, consisting of interfingering of seismic loops with subtle baselap-onlap relationships interpreted as compensationally stacked sand-prone turbidite lobes. See Figure 22a for location.
Figure 28. Time-structure map of the K230 marker in Parcel 2, showing the Big Thrum, Sandypoint, and Piscatiqui structures. Refer to text for discussion and Figure 22a for location.
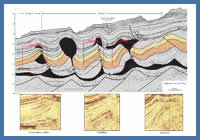
Figure 31
Seismic profile J to J�, showing a series of counter-regionally rotated minibasins flanked by extruded salt or associated salt welds. Several potential 3-way closure traps developed where minibasin margins terminate against squeezed allochthonous salt tongues or salt welds (e.g. Piscatiqui and Liscomb). See Figure 22a for location.
Seismic profile J to J�, showing a series of counter-regionally rotated minibasins flanked by extruded salt or associated salt welds. Several potential 3-way closure traps developed where minibasin margins terminate against squeezed allochthonous salt tongues or salt welds (e.g. Piscatiqui and Liscomb). See Figure 22a for location.
Figure 29. Seismic profile K to K’ crossing the Sandypoint, Big Thrum, and Seawolf structures in Parcel 2. Note the variation in amplitudes across the crestal fault of the Big Thrum structure. See Figures 22a and 28 for location.
Figure 30. Uninterpreted and interpreted profiles showing a close-up of the Big Thrum structure in Parcel 2. Note the inverted thick between the K230 and K195 markers, interpreted to correspond to turbidite sand deposits in a negative relief minibasin prior to folding. There is also evidence for submarine channels (c) at multiple stratigraphic levels, indicating that Big Thrum was positioned along an active turbidite corridor during the Early Cretaceous. See Figure 28 for location, and text for discussion.
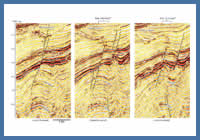
Figure 32
Three seismic profiles crossing the western part of the Liscomb structure, showing a potential gas chimney above the fold crest. See Figure 22a for location.
Three seismic profiles crossing the western part of the Liscomb structure, showing a potential gas chimney above the fold crest. See Figure 22a for location.
Figure 31. Seismic profile J to J’, showing a series of counter-regionally rotated minibasins flanked by extruded salt or associated salt welds. Several potential 3-way closure traps developed where minibasin margins terminate against squeezed allochthonous salt tongues or salt welds (e.g. Piscatiqui and Liscomb). See Figure 22a for location.
Figure 32. Three seismic profiles crossing the western part of the Liscomb structure, showing a potential gas chimney above the fold crest. See Figure 22a for location.