


Regional Geology Parcel 2 Figures
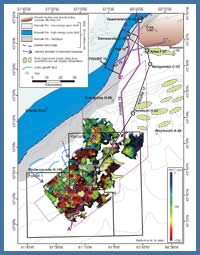
Figure 10
Schematic paleogeography map for the Jurassic, showing the Abenaki carbonate platform along the edge of the stable continental margin. Three main facies zones are shown, corresponding to an inner low energy shelf, an outer high energy shelf, and the steep foreslope that extends into deepwater (see Kidston et al., 2005 for further details). Coeval with the development of the carbonate bank was the deposition of the Upper Jurassic Mic Mac Formation and its equivalents, consisting of a mix of clastics and carbonates that are thickest in the NE corner of the figure. Significant growth faulting and salt mobilization took place while the Mic Mac Formation was deposited. In the areas of Parcels 1 and 2, a time-thickness map for the J350 and J280 markers shows the distribution of the earliest minibasins above autochthonous salt. The minibasins are assumed to contain Jurassic strata composed of the deepwater equivalents of the Mic Mac Formation, as well as strata equivalent to the Mohican Formation. Sediment input into deepwater is presumed to be normal or sub-normal to the steep Abenaki slope. Salt outlines on this map are highly schematic. See text for details.
Schematic paleogeography map for the Jurassic, showing the Abenaki carbonate platform along the edge of the stable continental margin. Three main facies zones are shown, corresponding to an inner low energy shelf, an outer high energy shelf, and the steep foreslope that extends into deepwater (see Kidston et al., 2005 for further details). Coeval with the development of the carbonate bank was the deposition of the Upper Jurassic Mic Mac Formation and its equivalents, consisting of a mix of clastics and carbonates that are thickest in the NE corner of the figure. Significant growth faulting and salt mobilization took place while the Mic Mac Formation was deposited. In the areas of Parcels 1 and 2, a time-thickness map for the J350 and J280 markers shows the distribution of the earliest minibasins above autochthonous salt. The minibasins are assumed to contain Jurassic strata composed of the deepwater equivalents of the Mic Mac Formation, as well as strata equivalent to the Mohican Formation. Sediment input into deepwater is presumed to be normal or sub-normal to the steep Abenaki slope. Salt outlines on this map are highly schematic. See text for details.
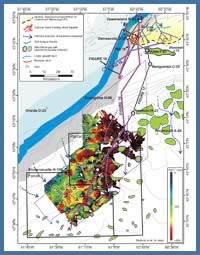
Figure 11
Schematic paleogeography map for the lowermost Cretaceous. The map shows the southward progradation of the sand-prone Lower Missisauga Formation along the Jurassic carbonate bank. Several canyons are present near the outer shelf, and these are presumed to have supplied clastics to the south and southwest where the J280 to K230 time-thickness map is thickest. Clastics are also inferred to have been supplied down the carbonate slope. This interpretation is based in part on an amplitude extraction from the J280 marker which appears to show a series of high amplitude interfingering submarine fans sourced from the NW. Salt outlines on this map are highly schematic. Refer to text for details.
Schematic paleogeography map for the lowermost Cretaceous. The map shows the southward progradation of the sand-prone Lower Missisauga Formation along the Jurassic carbonate bank. Several canyons are present near the outer shelf, and these are presumed to have supplied clastics to the south and southwest where the J280 to K230 time-thickness map is thickest. Clastics are also inferred to have been supplied down the carbonate slope. This interpretation is based in part on an amplitude extraction from the J280 marker which appears to show a series of high amplitude interfingering submarine fans sourced from the NW. Salt outlines on this map are highly schematic. Refer to text for details.
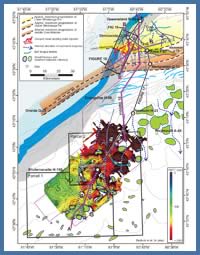
Figure 12
Schematic paleogeography map for sand-prone Missisauga and lowermost Logan Canyon Formations and equivalent strata. Local preservation of offlap breaks (i.e. the transition from topsets to foresets) indicates these sandy systems built progressively toward the south. Recognition of canyons west of Alma implies that clastics associated with these delta systems were also transported into deepwater, an idea confirmed by Newburn H-23 which penetrated several thin intervals of sandstone to pebble conglomerates. A time-thickness map for the K230 to K140 interval suggests the primary sediment source for Parcels 1 and 2 was from the westernmost Sable Subbasin. This interval is interpreted to have reservoir potential, with the thickest sediment accumulations taking place in a complex network of minibasins believed to occupy a mid to lower slope position. Refer to text for details.
Schematic paleogeography map for sand-prone Missisauga and lowermost Logan Canyon Formations and equivalent strata. Local preservation of offlap breaks (i.e. the transition from topsets to foresets) indicates these sandy systems built progressively toward the south. Recognition of canyons west of Alma implies that clastics associated with these delta systems were also transported into deepwater, an idea confirmed by Newburn H-23 which penetrated several thin intervals of sandstone to pebble conglomerates. A time-thickness map for the K230 to K140 interval suggests the primary sediment source for Parcels 1 and 2 was from the westernmost Sable Subbasin. This interval is interpreted to have reservoir potential, with the thickest sediment accumulations taking place in a complex network of minibasins believed to occupy a mid to lower slope position. Refer to text for details.
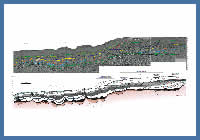
Figure 15
Regional seismic line A - A'. The line is arranged roughly NNE (right) to SSW (left) and crosses the Missisauga and Logan Canyon formations and their seaward equivalents. West of Alma, Missisauga equivalent strata are characterized by a series of topsets to foresets that record the southward advance of delta systems adjacent to the Abenaki carbonate bank. These strata believed to pass seaward into a series of submarine fans deposited above local steps on the middle to lower slope in the areas of Parcels 1 and 2. See Figures 10-13 for location and text for details.
Regional seismic line A - A'. The line is arranged roughly NNE (right) to SSW (left) and crosses the Missisauga and Logan Canyon formations and their seaward equivalents. West of Alma, Missisauga equivalent strata are characterized by a series of topsets to foresets that record the southward advance of delta systems adjacent to the Abenaki carbonate bank. These strata believed to pass seaward into a series of submarine fans deposited above local steps on the middle to lower slope in the areas of Parcels 1 and 2. See Figures 10-13 for location and text for details.
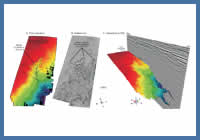
Figure 18
Perspective views of, and a coherence time-slice through, the middle Huckleberry Canyon located west of Alma. See Figures 10-13 for figure location.
Perspective views of, and a coherence time-slice through, the middle Huckleberry Canyon located west of Alma. See Figures 10-13 for figure location.
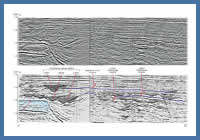
Figure 19
Seismic line C - C' crossing roughly normal to the direction of progradation of the Lower and Upper Missisauga Formations, and lowermost Logan Canyon Formation. Several erosional features are recognized above the topsets. The most prominent are associated with the Huckleberry canyon system located near the intersection of the Abenaki carbonate bank and southward prograding Lower Cretaceous delta systems. These canyons are interpreted to form the conduits for clastics funneled into deepwater in the areas of Parcels 1 and 2. See Figures 10-13 for figure location, and Figure 18 for a perspective view of the middle Huckleberry Canyon.
Seismic line C - C' crossing roughly normal to the direction of progradation of the Lower and Upper Missisauga Formations, and lowermost Logan Canyon Formation. Several erosional features are recognized above the topsets. The most prominent are associated with the Huckleberry canyon system located near the intersection of the Abenaki carbonate bank and southward prograding Lower Cretaceous delta systems. These canyons are interpreted to form the conduits for clastics funneled into deepwater in the areas of Parcels 1 and 2. See Figures 10-13 for figure location, and Figure 18 for a perspective view of the middle Huckleberry Canyon.
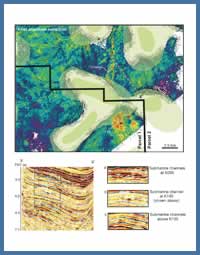
Figure 21
Amplitude extraction from the K140 marker showing an Aptian(?) submarine channel system (on the eastern flank of the Big Thrum prospect - Parcel 2) and corresponding submarine fan deposited above a local step on the middle to lower slope (northern part of the Crows Neck prospect - Parcel 1). A representative seismic profile across the eastern flank of the 'Big Thrum' prospect (line X-X') shows the development of submarine channels at several stratigraphic levels in Lower Cretaceous strata.
Amplitude extraction from the K140 marker showing an Aptian(?) submarine channel system (on the eastern flank of the Big Thrum prospect - Parcel 2) and corresponding submarine fan deposited above a local step on the middle to lower slope (northern part of the Crows Neck prospect - Parcel 1). A representative seismic profile across the eastern flank of the 'Big Thrum' prospect (line X-X') shows the development of submarine channels at several stratigraphic levels in Lower Cretaceous strata.
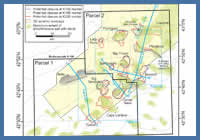
Figure 22a
Blob map showing the outlines of potential structural closures identified in 3D seismic at the K230, K195, and K140 seismic markers in Parcels 1 and 2. Where possible, the closure areas were constrained using the C5, C10, and C30 structure maps presented in Shell (2002). 1Note that the velocity model for depth converted structural maps presented in Shell's 'Thrumcap Survey Geophysical Review' (CNSOPB Program NS24-S006-001E/2E), were based on stacking velocities of the sediment layers and water column, but because of anomalous results produced by salt diapirs and salt sheets, a salt layer was not included in the model. A key uncertainty therefore is the effect the isolated salt diapirs and salt sheets/tongues have on the structures described above. Also shown are figure locations, the outline of the Thrumcap 3D seismic volume, and the maximum extent of allochthonous salt and inferred salt stocks.
Blob map showing the outlines of potential structural closures identified in 3D seismic at the K230, K195, and K140 seismic markers in Parcels 1 and 2. Where possible, the closure areas were constrained using the C5, C10, and C30 structure maps presented in Shell (2002). 1Note that the velocity model for depth converted structural maps presented in Shell's 'Thrumcap Survey Geophysical Review' (CNSOPB Program NS24-S006-001E/2E), were based on stacking velocities of the sediment layers and water column, but because of anomalous results produced by salt diapirs and salt sheets, a salt layer was not included in the model. A key uncertainty therefore is the effect the isolated salt diapirs and salt sheets/tongues have on the structures described above. Also shown are figure locations, the outline of the Thrumcap 3D seismic volume, and the maximum extent of allochthonous salt and inferred salt stocks.
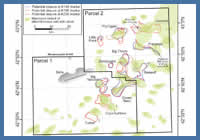
Figure 22b
Same blob map presented in (a) but without bathymetric contours, 3D seismic coverage, and figure locations.
Same blob map presented in (a) but without bathymetric contours, 3D seismic coverage, and figure locations.
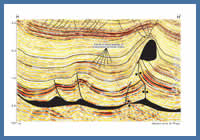
Figure 23
Profile H to H' showing the key structure types in the areas of Parcels 1 and 2. Most traps are either 3-way closures against salt flanks, subsalt, or fault welds, or are associated with folds that require closure of some sort on the flanks of salt, below salt, or along a fault weld. Note the seismic facies character between the K230 and K140 markers, consisting of interfingering of seismic loops with subtle baselap-onlap relationships interpreted as compensationally stacked sand-prone turbidite lobes. See Figure 22a for location.
Profile H to H' showing the key structure types in the areas of Parcels 1 and 2. Most traps are either 3-way closures against salt flanks, subsalt, or fault welds, or are associated with folds that require closure of some sort on the flanks of salt, below salt, or along a fault weld. Note the seismic facies character between the K230 and K140 markers, consisting of interfingering of seismic loops with subtle baselap-onlap relationships interpreted as compensationally stacked sand-prone turbidite lobes. See Figure 22a for location.
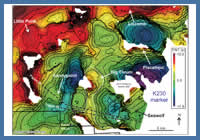
Figure 28
Time-structure map of the K230 marker in Parcel 2, showing the Big Thrum, Sandypoint, and Piscatiqui structures. Refer to text for discussion and Figure 22a for location.
Time-structure map of the K230 marker in Parcel 2, showing the Big Thrum, Sandypoint, and Piscatiqui structures. Refer to text for discussion and Figure 22a for location.
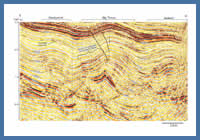
Figure 29
Seismic profile K to K' crossing the Sandypoint, Big Thrum, and Seawolf structures in Parcel 2. Note the variation in amplitudes across the crestal fault of the Big Thrum structure. See Figures 22a and 28 for location.
Seismic profile K to K' crossing the Sandypoint, Big Thrum, and Seawolf structures in Parcel 2. Note the variation in amplitudes across the crestal fault of the Big Thrum structure. See Figures 22a and 28 for location.
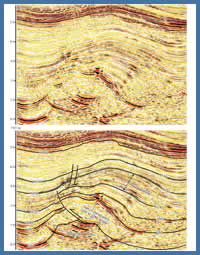
Figure 30
Uninterpreted and interpreted profiles showing a close-up of the Big Thrum structure in Parcel 2. Note the inverted thick between the K230 and K195 markers, interpreted to correspond to turbidite sand deposits in a negative relief minibasin prior to folding. There is also evidence for submarine channels (c) at multiple stratigraphic levels, indicating that Big Thrum was positioned along an active turbidite corridor during the Early Cretaceous. See Figure 28 for location, and text for discussion.
Uninterpreted and interpreted profiles showing a close-up of the Big Thrum structure in Parcel 2. Note the inverted thick between the K230 and K195 markers, interpreted to correspond to turbidite sand deposits in a negative relief minibasin prior to folding. There is also evidence for submarine channels (c) at multiple stratigraphic levels, indicating that Big Thrum was positioned along an active turbidite corridor during the Early Cretaceous. See Figure 28 for location, and text for discussion.
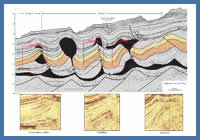
Figure 31
Seismic profile J to J', showing a series of counter-regionally rotated minibasins flanked by extruded salt or associated salt welds. Several potential 3-way closure traps developed where minibasin margins terminate against squeezed allochthonous salt tongues or salt welds (e.g. Piscatiqui and Liscomb). See Figure 22a for location.
Seismic profile J to J', showing a series of counter-regionally rotated minibasins flanked by extruded salt or associated salt welds. Several potential 3-way closure traps developed where minibasin margins terminate against squeezed allochthonous salt tongues or salt welds (e.g. Piscatiqui and Liscomb). See Figure 22a for location.
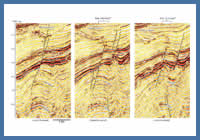
Figure 32
Three seismic profiles crossing the western part of the Liscomb structure, showing a potential gas chimney above the fold crest. See Figure 22a for location.
Three seismic profiles crossing the western part of the Liscomb structure, showing a potential gas chimney above the fold crest. See Figure 22a for location.