


Regional Geology Figures
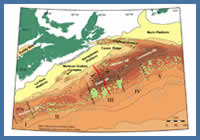
Figure 1
Major tectonic elements of the Scotian Basin showing depth to basement in kilometers and bathymetric contours in grey. The black dots are industry wells, with the green dots ones that penetrated salt. The pale green areas represent earliest Jurassic age Argo formation salt structures, with the Roman numerals indicating the salt/basement regions as defined by Kidston et al. (2002) and Shimeld (2005). Trace of the regional composite seismic profile (Figure 3) is shown in red. Copyright © Geological Survey of Canada Atlantic - used with permission.
Major tectonic elements of the Scotian Basin showing depth to basement in kilometers and bathymetric contours in grey. The black dots are industry wells, with the green dots ones that penetrated salt. The pale green areas represent earliest Jurassic age Argo formation salt structures, with the Roman numerals indicating the salt/basement regions as defined by Kidston et al. (2002) and Shimeld (2005). Trace of the regional composite seismic profile (Figure 3) is shown in red. Copyright © Geological Survey of Canada Atlantic - used with permission.
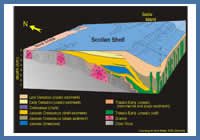
Figure 2
Isometric view of the western portion of the Scotian Basin, offshore Nova Scotia. The thickness of the basal Triassic-Jurassic salt is exaggerated in this view. Copyright © Atlantic Geoscience Society - used with permission.
Isometric view of the western portion of the Scotian Basin, offshore Nova Scotia. The thickness of the basal Triassic-Jurassic salt is exaggerated in this view. Copyright © Atlantic Geoscience Society - used with permission.
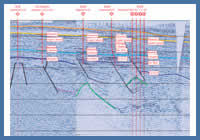
Figure 3
Composite seismic section across the Sable Subbasin; the track is shown in Figure 1. This 200 kilometer long composite profile starts landward of the Jurassic carbonate bank, runs across the Sable Subbasin through several gas fields, over the shelf break and the slope across the Annapolis and Crimson deepwater wells, and out into the salt canopy complex. The profile is composed of the following data sets and used with the kind permission of the respective organizations (from west to east): GSI 2D 201 (Geophysical Service Incorporated), ExxonMobil Mega-Merge 3D (ExxonMobil), ExxonMobil North Triumph 3D (ExxonMobil), Marathon 3D (CGGVeritas) and the TGS Regional 2D (TGS-NOPEC). A comprehensive description of this line can be found in Kidston et al., 2007.
Composite seismic section across the Sable Subbasin; the track is shown in Figure 1. This 200 kilometer long composite profile starts landward of the Jurassic carbonate bank, runs across the Sable Subbasin through several gas fields, over the shelf break and the slope across the Annapolis and Crimson deepwater wells, and out into the salt canopy complex. The profile is composed of the following data sets and used with the kind permission of the respective organizations (from west to east): GSI 2D 201 (Geophysical Service Incorporated), ExxonMobil Mega-Merge 3D (ExxonMobil), ExxonMobil North Triumph 3D (ExxonMobil), Marathon 3D (CGGVeritas) and the TGS Regional 2D (TGS-NOPEC). A comprehensive description of this line can be found in Kidston et al., 2007.
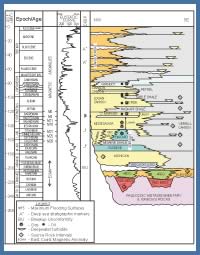
Figure 4
Generalized stratigraphic column for the Scotian Basin, offshore Nova Scotia (CNSOPB). Detailed columns can be found in Wade & MacLean, (1990). Sea level curve from Haq et al. (1987).
Generalized stratigraphic column for the Scotian Basin, offshore Nova Scotia (CNSOPB). Detailed columns can be found in Wade & MacLean, (1990). Sea level curve from Haq et al. (1987).
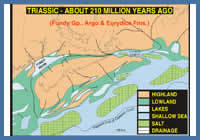
Figure 5
Simplified paleogeographic reconstruction of the Scotian Basin during the Late Triassic (Rhaetian) ca. 210 mya. Salt deposition likely was initiated during this period although on a much smaller scale than illustrated here. Argo formation salts of this age have yet to be sampled in this basin but are present on the southeast Grand Banks. Copyright © Atlantic Geoscience Society - used with permission.
Simplified paleogeographic reconstruction of the Scotian Basin during the Late Triassic (Rhaetian) ca. 210 mya. Salt deposition likely was initiated during this period although on a much smaller scale than illustrated here. Argo formation salts of this age have yet to be sampled in this basin but are present on the southeast Grand Banks. Copyright © Atlantic Geoscience Society - used with permission.
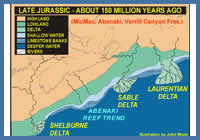
Figure 6
Simplified paleogeographic reconstruction of the Scotian Basin during the Late Jurassic (~Kimmeridgian) time, ca. 150 mya. This period represents the final stage of the Abenaki carbonate margin; soon to be overwhelmed by the rapidly advancing MicMac formation siliciclastic delta systems. The margin had a ramp-like morphology between the Sable and Laurentian deltas and developed a more classic fringing reef profile elsewhere. Copyright © Atlantic Geoscience Society - used with permission.
Simplified paleogeographic reconstruction of the Scotian Basin during the Late Jurassic (~Kimmeridgian) time, ca. 150 mya. This period represents the final stage of the Abenaki carbonate margin; soon to be overwhelmed by the rapidly advancing MicMac formation siliciclastic delta systems. The margin had a ramp-like morphology between the Sable and Laurentian deltas and developed a more classic fringing reef profile elsewhere. Copyright © Atlantic Geoscience Society - used with permission.
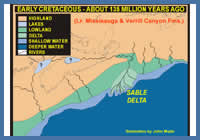
Figure 7
Simplified paleogeographic reconstruction of the Scotian Basin during the Early Cretaceous (~Valanginian) time, ca. 135 mya. Deltaic sedimentation in the east was consolidated and focus in the Sable Subbasin, having ceased in the Shelburne Subbasin to the west due to depletion of its sediment sources. The Sable Subbasin's faulted basement and deeply-buried salts coupled with rapid sedimentation facilitated the creation of many syndepositional growth-fault structures and resultant over-pressure conditions. Copyright © Atlantic Geoscience Society - used with permission.
Simplified paleogeographic reconstruction of the Scotian Basin during the Early Cretaceous (~Valanginian) time, ca. 135 mya. Deltaic sedimentation in the east was consolidated and focus in the Sable Subbasin, having ceased in the Shelburne Subbasin to the west due to depletion of its sediment sources. The Sable Subbasin's faulted basement and deeply-buried salts coupled with rapid sedimentation facilitated the creation of many syndepositional growth-fault structures and resultant over-pressure conditions. Copyright © Atlantic Geoscience Society - used with permission.
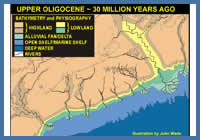
Figure 8
Simplified paleogeographic reconstruction of the Scotian Basin during the Upper Oligocene (Chattian) ca. 30 mya. The figure illustrates the Chattian age sea level fall and resultant exposure and erosion on the Nova Scotia margin (Chattian unconformity). Smaller shelf margin deltas and their locations are speculative. Slightly modified after the Atlantic Geoscience Society - Copyright © AGS, used with permission.
Simplified paleogeographic reconstruction of the Scotian Basin during the Upper Oligocene (Chattian) ca. 30 mya. The figure illustrates the Chattian age sea level fall and resultant exposure and erosion on the Nova Scotia margin (Chattian unconformity). Smaller shelf margin deltas and their locations are speculative. Slightly modified after the Atlantic Geoscience Society - Copyright © AGS, used with permission.
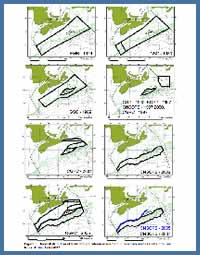
Figure 9
Areal distribution of historical petroleum resource and reserves assessments offshore Nova Scotia, 1976-2007.
Areal distribution of historical petroleum resource and reserves assessments offshore Nova Scotia, 1976-2007.