Basement Structure
Basement Structure
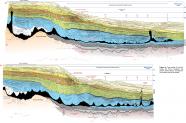
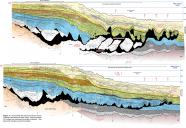
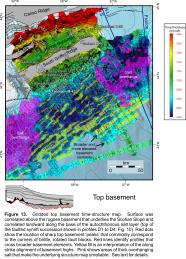
Key basement elements in the study area are shown on the time-structure map in Figure 13. The landward parts of the study area are dominated by two basement elements - a deep rift graben known as the Huron Subbasin (an eastern extension of the Abenaki and Sable subbasins), and a prominent basement high that borders it to the south, referred to as the South Griffin Ridge (SGR) (OETR, 2011; CNSOPB, 2013; Fig. 13). No clear basement marker is present below the Huron Subbasin on profiles D1 through D4 (Figs. 10, 11). Instead, a generally poorly imaged faulted interval is observed beneath its northern flank on all four type sections. Based on its faulted appearance and similarities in seismic facies to synrift clastics on the LaHave Platform, the interval is interpreted to correspond to a Triassic synrift succession beneath a deformed interval of autochthonous salt. The lack of impedance contrasts between synrift clastics and Meguma basement has previously been noted by Wade and MacLean (1990), and forces correlation of an approximate top-basement marker beneath the synrift package, increasing interpretation uncertainty. Similarly, no obvious seismic reflection defines the top of the South Griffin Ridge (SGR); rather, it is identified principally on the basis of patterns in sedimentary units in the Huron Subbasin adjacent to the SGR. The structural high appears to be asymmetric on time-migrated seismic profiles, with a steeper wall on its landward side that generally lacks coherent reflections, and a less steep seaward flank that shows subtle faulting. The weaker northeast continuation of the ECMA is found about 30 km seaward of the SGR (Fig. 3); as such the SGR is located landward of the COB and probably corresponds to a large faulted horst block composed of continental crust. The elevated structure is likely veneered by salt expelled from the Huron Subbasin (Figs. 10, 11), but we emphasize that these interpretations are based on subtle seismic reflection patterns in a poorly imaged part of the seismic section on all four type profiles.
In the Call area southeast of the SGR, the top basement marker is increasingly reflective, showing a corresponding increase in rugosity towards deeper water on section D1, D2, and D3 (Figs. 10, 11). Nearest the SGR, one or two high amplitude reflections define the top basement surface, which has a smoother, generally low-relief topography offset only by minor undulations that may correspond to planar faults (see also Sibuet et al., 2012). The smoother basement character passes to the southeast, below and seaward of the BSW, into a highly rugose topographic surface with strong returns coming from one or two high impedance reflectors. The top basement surface is characterized by alternating peaks and troughs. In Figure 13, the sharp crests of these structural highs are identified by red dots and broader structures with multiple smaller peaks are identified by red lines. In general, the top basement surface gets shallower towards the south and southeast, where basement highs are generally broader. The “peaks” identified from one profile to the next commonly align, forming northeast-trending structures that can be continuous over distances of 20 to 40 km or more. Minor offsets are apparent along these structures and could have taken place across northwest-trending accommodation zones (transfer faults/fracture zones or relay ramps). These basement highs range in width from about 3 km to >7 km, with a maximum of 400 to 650 ms (twt) of relief relative to the immediately adjacent structural low. Using a conservative refraction velocity estimate of 5 km/s (from Funck et al., 2004), the maximum relief of these structures therefore ranges from 1.0 to 1.6 km. Internal reflections are generally incoherent, but some internal layered reflections are apparent, particularly on reprocessed seismic profiles published in OETR (2011) (e.g. reprocessed TGS line 964-100 on Panel 6-4-1a).
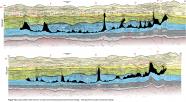
Listric fault planes are well imaged between basement highs on some profiles, and appear to sole out along a common undulating – though variably imaged – surface. As such, the pointed crests of these northeast trending structural elements are interpreted to be the corners of highly rotated brittle fault blocks. They are particularly well imaged immediately south of The Gully, outboard the Sable Slope Canopy (Fig. 2). Fault offsets are dominantly towards the southeast. Because of the dominant northeast-southwest trend of these apparent fault blocks, type sections D1, D2, and D3, which are roughly normal to these features, provide the best imaging (Figs. 10, 11). The rugose top basement topography is much less clear on strike profiles, and it should also be noted that imaging of this surface is significantly affected by overlying salt stocks remaining within or above the BSW (e.g. velocity pull-ups on lines D1, D2, and S1, Figs. 10, 12a). Similarly, although the top basement surface has been correlated with moderate confidence below the seaward overhang of the SWLS salt canopy (e.g. profile D4), the top basement surface in the landward parts of the SWLS, has only been mapped with a low degree of confidence. Here, the presence of seaward leaning salt feeders and stepped counter-regional systems severely diminishes seismic imaging. Salt, however, appears rooted above the top basement surface, implying that profile D4 has crossed into an autochthonous or para-autochthonous salt basin (Fig. 11).


