Line Drawings and Structure Maps
Line Drawings and Structure Maps
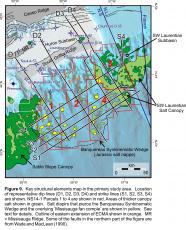
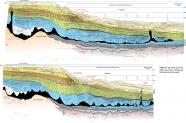
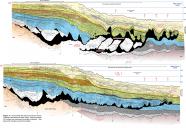
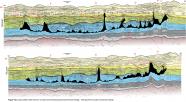
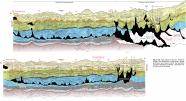
Four composite dip sections were assembled from available seismic profiles, and line drawings were generated that serve as “down-slope” type sections across the eastern Scotian Slope (locations shown in Fig. 9). From west to east they are herein named dip profiles D1, D2, D3 and D4 (Figs. 10, 11). Similarly, four composite strike sections were assembled and line drawings from these serve as “cross-slope” type sections. From south to north they are herein named strike profiles S1, S2 (Fig. 12a) S3 and S4 (Fig. 12b). These type sections are used to track proximal to distal and lateral thickness variations between key seismic markers, changes in seismic stratigraphy, and were selected to capture the range of structures observed on the eastern Scotian Slope.
The water column in all type sections was depth-converted using a velocity of 1500 m/s. As such, the vertical scale bar for the water column is in meters (identified in blue text) whereas the vertical scale bar in the sub-surface is in seconds (two-way travel time; identified in black text). This correction significantly reduces velocity sags associated with deep seafloor canyons and removes the overall velocity sag on dip profiles associated with the seaward increase in water depth. Similarly, water-column velocities were depth-converted on all time-structure maps.

