Mega-sequence 2 (MS-2) – Middle Jurassic (duration unknown, but probably <11 Ma)
Mega-sequence 2 (MS-2) – Middle Jurassic (duration unknown, but probably <11 Ma)
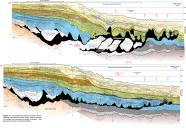
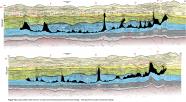
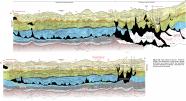
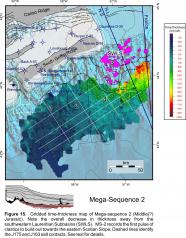
MS-2 forms a wedge-shaped deposit that is thickest along the northeastern slope outboard salt canopies expelled from the SWLS (e.g. northern part of Parcel 4); it is thinnest in Parcel 1 towards the southwest, approaching the Sable Slope Canopy (Fig. 15). The general sediment thickness pattern is clearly shown along profiles S1, S2, and S3 (Fig. 12a, 12b). Its lower boundary is the J175 marker described previously, and its upper boundary is the J163 marker (OETR, 2011) – a somewhat diachronous Middle Jurassic (intra-Callovian) marker that is roughly equivalent to the Scatarie limestone on the shelf (Weston et al., 2012; Fig. 4) and the J2 marker in the Sohm Abyssal Plain (Ebinger and Tucholke, 1988; Wade et al., 1995). MS-2 in many places corresponds to an abrupt increase in reflection amplitude. Some relatively continuous markers within this interval produce very strong reflections that probably correspond to carbonates or even volcanics. The reflection character is increasingly mixed towards the southwest Laurentian salt canopy, where MS-2 is 900 ms (twt) thick and terminates along a salt contact along the southwest edge of the Laurentian Subbasin (Figs. 15). Imaging of MS-2 diminishes substantially below thicker intervals of allochthonous salt, with significant velocity pull-ups increasing correlation uncertainty. Still, MS-2 appears to be thickest (up to 1400 ms twt) below the most easterly salt sheets in the study area (e.g. profile D4, Fig. 11). MS-2 diminishes to just 250 ms (twt) thick in the southwestern study area.
Like MS-1, MS-2 cannot be confidently correlated landward onto the shelf or into the SWLS. Although no direct correlation is possible, on the basis of stratigraphic position MS-2 and perhaps MS-1(?) on the slope are interpreted to be roughly equivalent to the interval between the J163 marker and the top of the autochthonous salt in the Huron Subbasin. This succession on the shelf consists of poorly imaged faulted strata that are thickest along the axis of the Huron Subbasin. Accommodation for these strata was provided by salt expulsion. Poorly imaged offlap breaks associated with the Mohican Formation (Toarcian? to Bajocian) are recognized locally, particularly towards the northeastern study area (see figure 5.6 of CNSOPB, 2013), but in general seismic imaging in this succession is too poor to make any definitive seismic-facies-based interpretations.
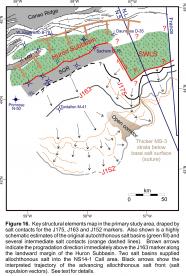
Salt contacts indicate salt rose sub-vertically out of the SWLS, flowing towards the southwest, south, and southeast as MS-2 strata aggraded seaward of the advancing salt front. The salt contact at the top of MS-2 (along the J163 marker) is located roughly 10 to 15 km ahead of the salt contact at the base of MS-2 (along the J175 marker) (Fig. 16). Strata within MS-2 also appear to terminate along poorly imaged salt contacts located along the southern flank of the SGR. Assuming that the SGR once formed the seaward depositional limit of the autochthonous salt basin, the salt front migrated seaward about 45 km by the end of MS-2 (though much of this may have taken place in the latter parts of MS-2). This indicates that salt expulsion from the Huron Subbasin, across the southern flank of the SGR, was at least partly contemporaneous with salt inflation and expulsion from the SWLS.

