Mega-sequence 3 (MS-3) – Middle to Late Jurassic (duration ~ 19 Ma)
Mega-sequence 3 (MS-3) – Middle to Late Jurassic (duration ~ 19 Ma)
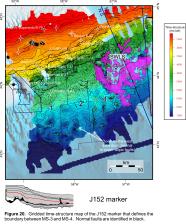
MS-3 is a structurally complex interval on the slope that records the co-development of a large salt nappe across the southwestern study area below parcels 1, 2, and 4 (corresponding to the BSW of Shimeld, 2004; Ings and Shimeld, 2006) and a poorly constrained stepped counter-regional salt expulsion system to the east below Parcel 3 (corresponding to the SWLS) (Fig. 9). Type section S4 nicely illustrates the cross-slope transition between these two salt tectonic domains, as does a comparison of dip profiles D1, D2, or-D3 with dip profile D4 (Figs. 10, 11, 12b). The lower boundary of MS-3 corresponds to the intra-Callovian J163 marker described previously (Fig. 4). Its upper boundary is our J152 marker located just below the top of the Jurassic succession on the shelf (calibrated by several outer shelf wells, and approximately one seismic loop deeper than the J150 marker of OETR, 2011). The J152 marker was correlated with moderate to high confidence onto the slope above the BSW, where it corresponds to a high amplitude reflection.
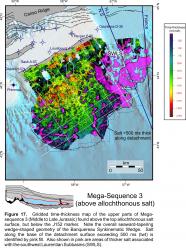
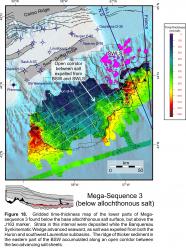
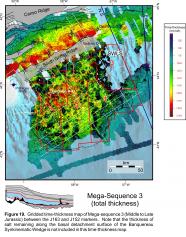
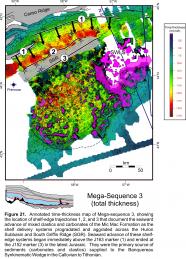
Because part of MS-3 was deposited above an allochthonous salt nappe on the slope, at the same time sediment accumulated outboard of the seaward advancing salt front, a repeated section is generated above and below the allochthonous salt layer or its equivalent weld. As such, three separate time-thickness maps are used to show the distribution of MS-3 strata. Figure 17 shows the time-thickness of MS-3 strata between the J152 marker and the top-allochthonous salt surface (or the equivalent weld) on the slope (i.e. MS-3 strata within the BSW). Figure 18 shows the time-thickness of MS-3 strata below the base-allochthonous salt surface (or the equivalent weld) but above the J163 marker on the slope (i.e. MS-3 strata beneath the BSW). Figure 19 shows the total time-thickness of MS-3 by adding the first two maps together, plus the thickness between the J152 and J163 markers on the shelf.
In contrast to the base salt surface that forms a prominent high amplitude trough, the top of the allochthonous salt layer commonly does not produce a distinctive high amplitude reflection, making it difficult to distinguish allochthonous salt from overlying low-amplitude strata. Recognition of subtle reflections within minibasins and turtles, combined with the use of several different on-the-fly post-stack filtering options, allowed us to correlate a top salt surface beneath the BSW with moderate confidence. Preserved salt within the nappe is dominantly in the form of rollers and pillows, but salt stocks and walls are increasingly common nearing the seaward termination of the BSW. The time-thickness between the base and top salt surfaces in the BSW was excluded from all three maps (i.e. remnants of salt within the BSW are not included in the time-thickness maps). Salt that is thicker than 500 ms (or roughly 1.1 km using 4400 m/s salt velocity from Shimeld, 2004) within the BSW is identified in Figure 17.
MS-3 above the allochthonous salt nappe and in the SWLS
On the slope, the BSW forms a prominent seaward-tapering wedge that is up to 2400 ms (twt) thick on the upper slope, thinning to < 500 ms thick on the lower slope, above the inflated seaward termination of the allochthonous salt layer (Fig. 17). A series of normal listric faults offsets the J152 marker immediately above the SGR (Fig. 20), across a region of poor seismic imaging. The faults sole out in allochthonous salt that was expelled from the Huron Subbasin during MS-2, with some seismic profiles indicating that large salt rollers still remain in the headward part of the BSW, above the seaward flank of the SGR (e.g. profiles D1 and D2; Fig. 10). Further down the slope, strata within the BSW show local thinning coincident with the thickest salt bodies. Seismic facies consist primarily of alternating intervals of high amplitude, continuous reflections and lower amplitude reflections. Salt-related structures down-slope from the SGR are complex, ranging from landward dipping sigmoidal reflections as described by Ings and Shimeld (2006, their figure 5), to roho systems with numerous listric faults that sole-out into the salt detachment (e.g. profile D3), and turtle structures (profiles S2, D1-D3). In some locations excessive rotation along listric faults, coupled with minor amounts of shortening, generated subtle folds with overthrusting (e.g. profiles D3 and S3; Figs. 11, 12b). Some shortening also appears to be recorded by thrust sheets immediately down-slope from the extensional faults at the head of the BSW (e.g. profile D2). Listric faults within the BSW are complex, and do no strictly record extension that takes place in the down-slope direction (relative to the modern slope) (Ings and Shimeld, 2006). Profiles S2 and S3 for example cross a 40 km long extensional fault zone that soles out along a north to northwest oriented chain of salt bodies (Fig. 20). The extension direction in this case is towards the southwest, perpendicular to the extension direction recorded by listric faults in the headward parts of the BSW.
In contrast to the prominent listric faults that offset the J152 marker all along the landward parts of the BSW, the J152 marker southeast of Sachem D-76 and Dauntless D-35 terminates along a series of seaward leaning salt welds associated with a complex stepped counterregional salt expulsion system in the landward parts of the SWLS (Parcel 3; see profiles D4 and S4; Figs. 12b, 13). The BSW does not exist here, and it is not possible with existing data to correlate MS-3 through this region. Salt feeders are complex and at least three tiers of salt overhang potential MS-3 stratigraphic intervals on some seismic profiles, significantly diminishing seismic imaging. Still, recognition of seismic reflections between some salt feeders and correlation of MS-3 below the expelled salt canopies seaward of the SWLS (e.g. seaward part of profile D4 (Fig. 11), indicates that MS-3 minibasins in some form should be present within the SWLS.
MS-3 below the salt nappe
MS-3 below and seaward of the BSW has been correlated with a moderate to high degree of confidence. Seismic imaging below the salt detachment surface is moderate to poor. Where there are no salt overhangs seaward of the BSW, imaging is excellent. Like the succession above the allochthonous salt, seismic facies are dominated by alternating continuous high amplitude reflections and low to moderate amplitude reflections. Reflections are generally parallel (layer-cake) and unfolded, broken only by a few small-offset normal faults out on the Sohm Abyssal Plain. Reflections terminate in the landward direction against the base salt contact (profiles D1, D2, and D3; Figs. 10, 11). MS-3 ranges from less than 200 ms (twt) thick beneath the northern and central parts of the BSW and towards the SWLS, to a maximum thickness of about 1400 ms (twt) near the lateral and seaward limits of the BSW (Fig. 18). Further seaward, MS-3 tapers gradually to less than 700 ms (twt) thick on the Sohm Abyssal Plain in the southeastern parts of the study area.
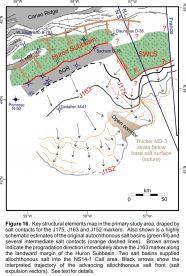
A 15 to 35 km wide and 45 km long ridge of thicker sub-salt sediment is present below the eastern half of the BSW (Fig. 18). Profile D3 crosses this sub-salt sediment ridge obliquely, showing a more abrupt vertical salt climb than is observed on profiles D1 and D2. The ridge defines a boundary between two advancing salt fronts – one coming from the seaward flank of the SGR (western and central parts of the BSW) and the other from the western margin of the SWLS (Figs. 16, 18). The convergence of these salt fronts probably formed a salt suture above the sub-salt sediment ridge, with salt from both areas forming part of the BSW detachment surface (discussed in more detail in a later section).
MS-3 on the shelf
On the shelf landward of the BSW, MS-3 sedimentation was focused along the axis of the Huron Subbasin, where up to 2300 ms (twt) of Mic Mac and equivalent strata were deposited immediately adjacent to, and above, the SGR (Fig. 21). Accommodation space was provided through salt expulsion. The onset of MS-3 on the shelf records an abrupt change in the seismic stratigraphic response immediately above the J163 marker. Early sedimentation was focused along clearly defined prograding clinoforms capped by a toplap surface. This initial Callovian to Oxfordian pulse of mixed siliciclastics (calibrated at West Esperanto B-78) forms a southeastward thickening wedge that extends all along the northern rim of the Huron Subbasin (e.g. northernmost part of profiles D3 and D4 – Fig. 11, and shelf-edge trajectory 1 on Fig. 21). In the center of the Huron Subbasin where this interval is thickest, internal reflections are poorly defined and cannot be correlated over long distances. It passes up-section into a mixed aggradational-progradational system consisting of more continuous alternating and generally parallel high and low amplitude reflections that terminate in a complexly faulted region adjacent to and above the SGR. Two distinct shelf-edge inflection trends are recognized on seismic profiles (shelf-edge trajectories 2 and 3 on Fig. 21). These record the southeastward advance of clastics and carbonates in the Oxfordian to Tithonian, immediately upslope from the BSW. Several wells penetrate the upper parts of MS-3 above the SGR. Louisbourg J-47 encountered over 1800 m of Upper Jurassic strata dominated by thick intervals of tight, marly, micritic and oolitic limestones, with thinner interbedded delta front and shallow marine sands. South Griffin J-13 encountered a similar Upper Jurassic succession with more than 1300 m of alternating shallow marine sandstones and carbonates.

