Mega-sequence 4 (MS-4) – Latest Jurassic to Mid Cretaceous (Aptian) (duration ~ 34 Ma)
Mega-sequence 4 (MS-4) – Latest Jurassic to Mid Cretaceous (Aptian) (duration ~ 34 Ma)
MS-4 marks an abrupt change in the distribution of sediments on the shelf and slope (Fig. 22), with a corresponding change in seismic facies character (Fig. 23; described below). The lower boundary of MS-4 is the J152 marker described in the previous section. Its upper boundary is our K112 surface that, rather than corresponding to a distinct seismic reflection, instead corresponds to a regionally important seismic facies boundary on the slope (described in the following section). This boundary, which we anticipate will be somewhat diachronous, ties to the base of an Early Albian interval at Tantallon M-41 on the upper slope (OETR, 2011). Seismic correlation into equivalent shelf strata is difficult, owing to the absence of distinct reflectors and the presence of growth faults, but the time-equivalent surface is probably found near the top or slightly above the Naskapi Member on the outer shelf (generally latest Aptian; Weston et al., 2012). As such, MS-4 on the slope is equivalent of the Missisauga and the lowermost Logan Canyon formations on the shelf (Fig. 4).
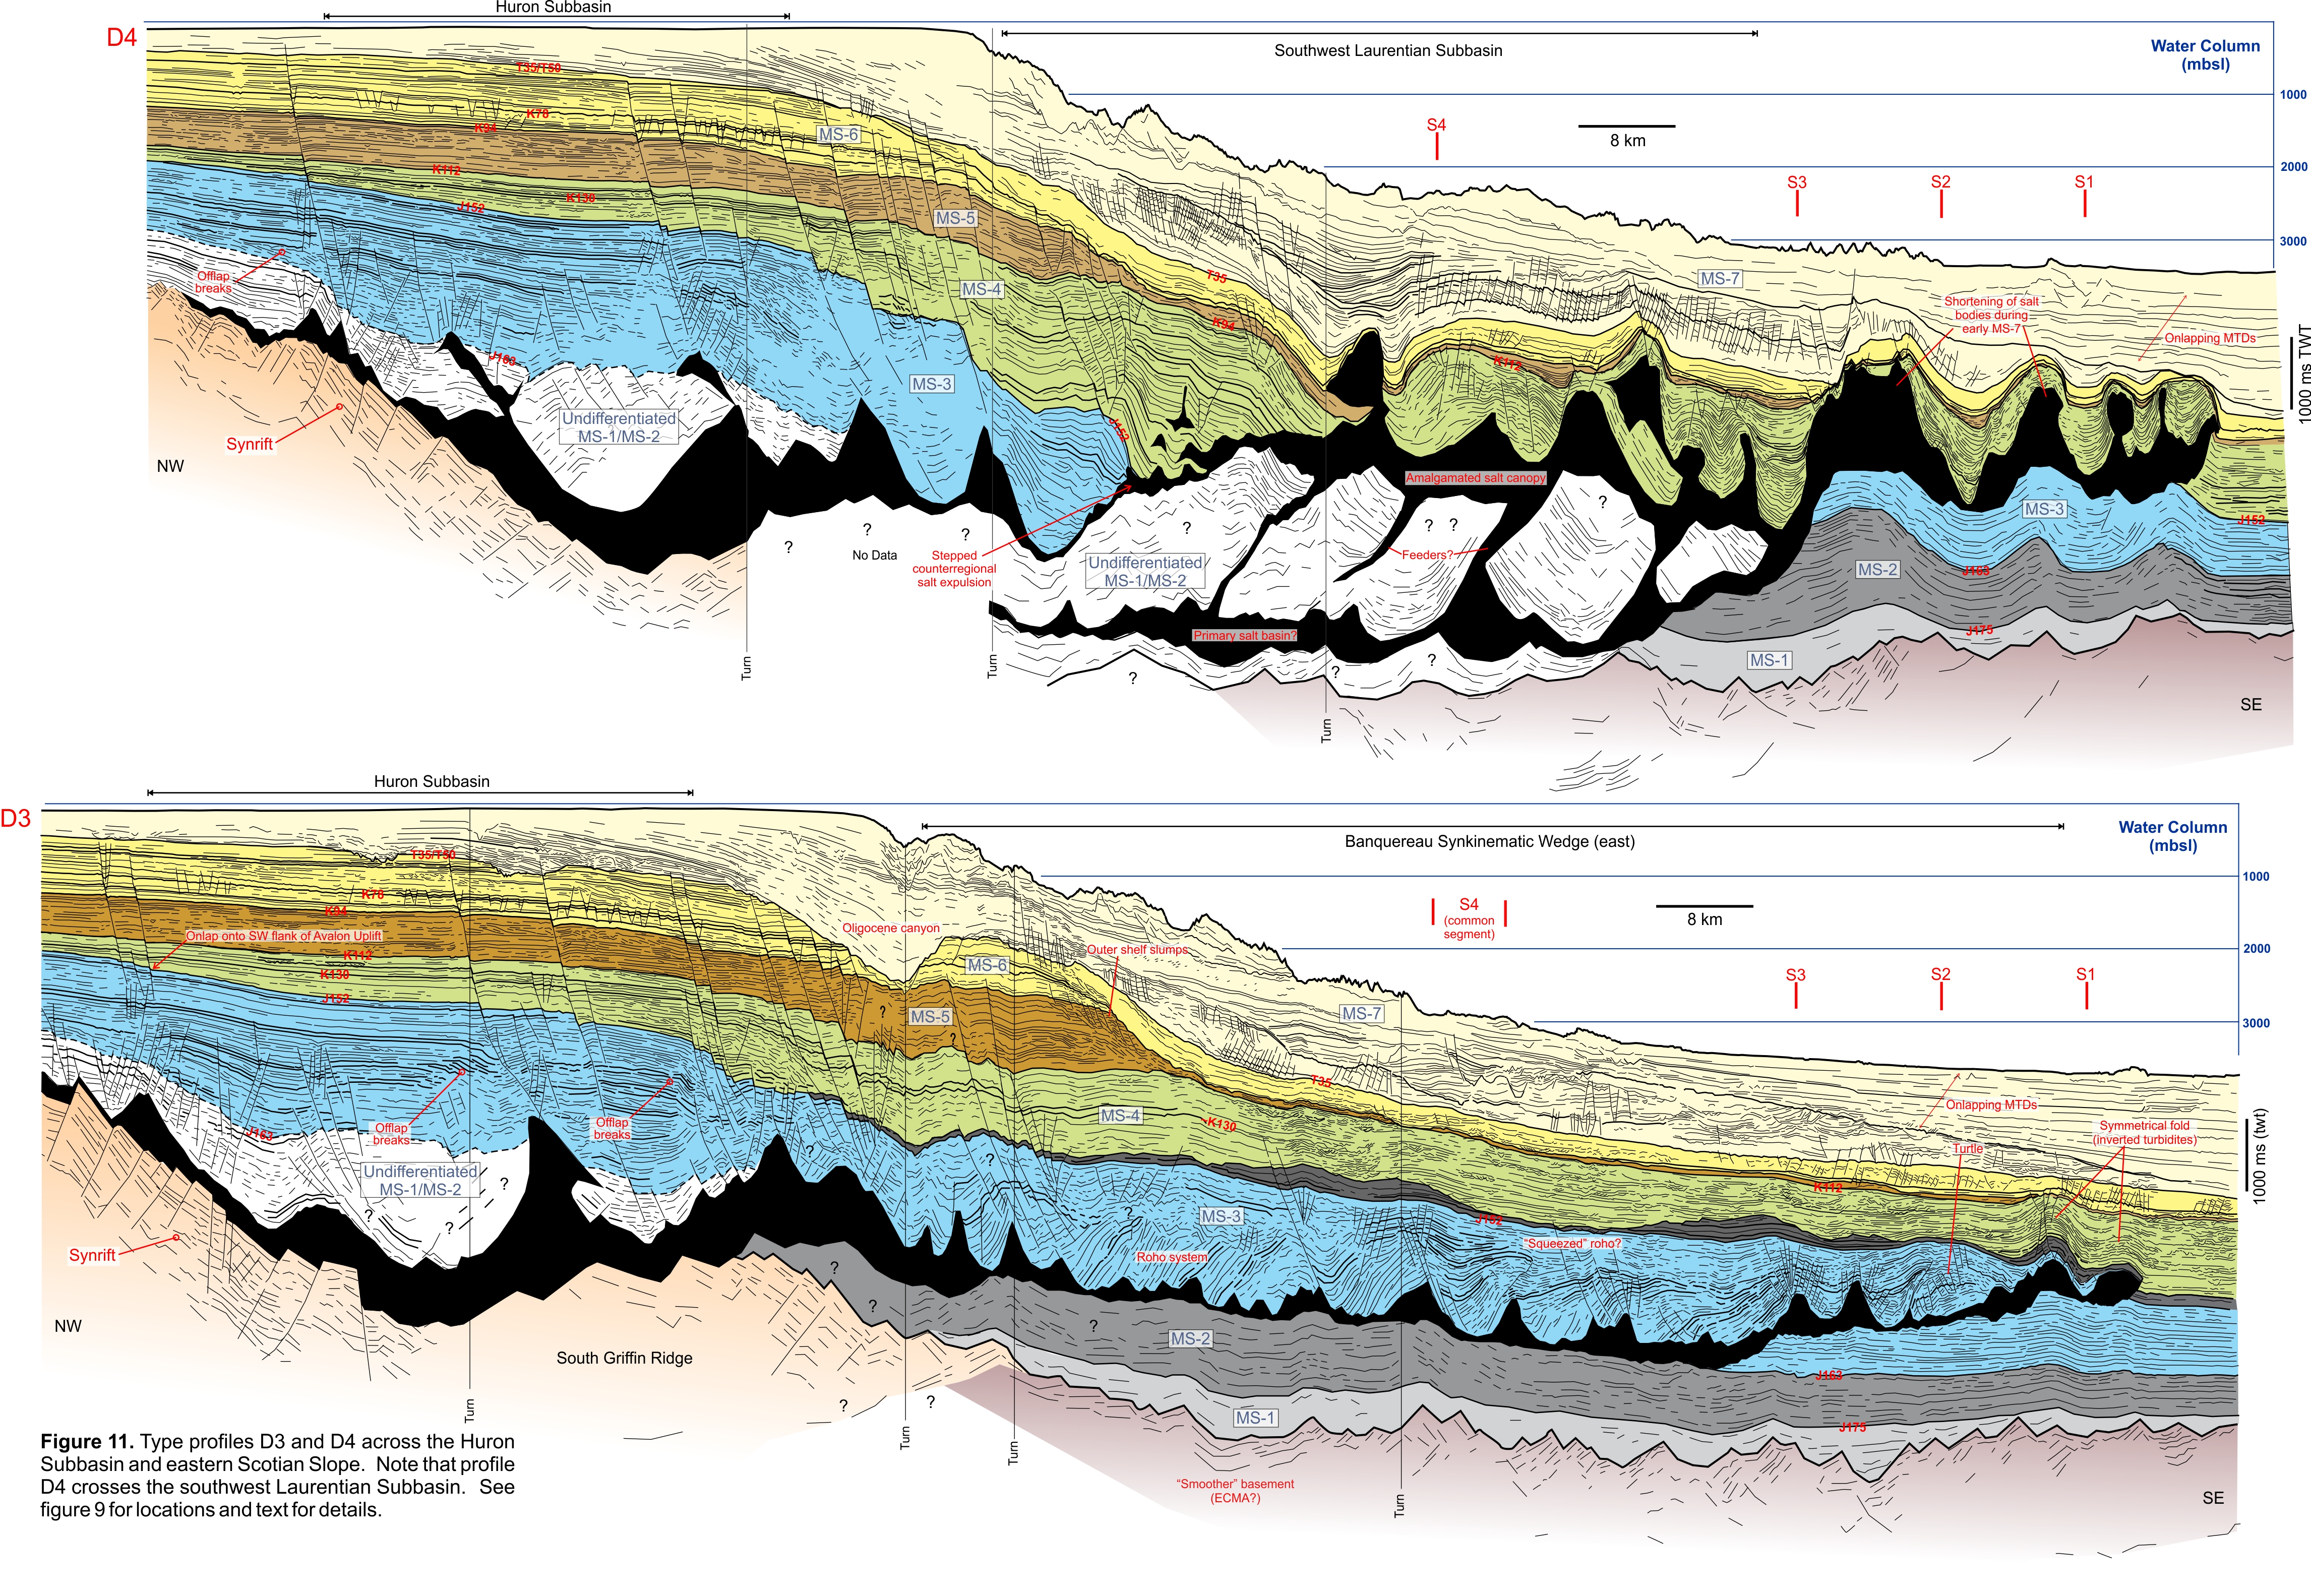
On the shelf, the transition from MS-3 to MS-4 takes place across the J152 marker that defines an important boundary separating parallel reflections below from divergent or onlapping reflections above. The discordance across this boundary is particularly well defined on the landward parts of profiles D3 and D4 (Fig. 11), which cross the southwestern flank of the Avalon Uplift (Fig. 2). MS-4 thins abruptly to the northeast and this pattern reflects the onlap and thinning of MS-4 strata onto the up-arched J152 marker (Fig. 22). In contrast to MS-3, little accommodation formed above the Huron Subbasin during MS-4. Instead, MS-4 forms a seaward-thickening wedge and the thickest shelf deposits are noticeably shifted to the southwest, where the Huron Subbasin transitions into the Sable Subbasin (immediately outboard the Missisauga Ridge). MS-4 is about 1000 ms (twt) thick here (Fig. 22). Several wells penetrate MS-4 on the shelf, where they encountered a Lower Cretaceous succession of porous fluvial-deltaic sandstones of the Missisauga Formation above and below an interval of oolitic limestones referred to as the O-marker, and capped by Naskapi Member shales (Wade and MacLean, 1990; Fig. 4).
Shelf-edge trajectories in MS-4 are difficult to identify, but a trend of subtle offlap breaks has been correlated immediately above the seaward edge of the SGR within the lower part of MS-4 (shelf-edge trajectory 4; Fig. 22). Seaward of the SGR, MS-4 is thickest in two areas – on the upper slope in the western study area (in Parcel 1) and in the landward parts of the SWLS in the eastern study area (in Parcel 3). In the western study area, it reaches a maximum time-thickness of 2100 ms (twt) across a series of northeast trending outer shelf listric growth faults that sole out in the salt detachment below the BSW. Here, a thickened lens of strata above the O-marker (K-130 marker) is largely responsible for the overall thickness increase (e.g. profiles D1 and D2), though some growth also took place earlier, seaward of shelf-edge trajectory 4. Shelf-edge trajectory 5 is tentatively placed along the trend of this heavily faulted Upper Missisauga equivalent lens (Fig. 22), which we interpret as a shelf-edge delta.
Missisauga fan complex
On the slope, the transition from MS-3 to MS-4 takes place across a complex interval immediately above the J152 marker, but below a prominent unconformity (Fig. 23). The seismically identified slope unconformity has not been calibrated by a well, but its stratigraphic position is consistent with the near-base Cretaceous Unconformity (NBCU) described by Weston et al (2012). As such, the interval between the J152 marker and this erosive surface may record the complex stratigraphic response on the slope to the Avalon Uplift on the shelf. The unconformity is particularly well imaged above the eastern and seaward parts of the BSW, where it forms a series of 3 to 5 km wide curvi-linear canyons separated by 4 to 13 km wide down-slope elongated erosional remnants. The erosional remnants are up to 400 ms thick (twt) and contain broad high amplitude and continuous peaks and troughs on the lower slope, with increasingly common lower amplitude reflections moving up the slope. Locally, more than one erosive surface is evident above these features on the upper slope. The erosional remnants are highlighted in grey on the type profiles (Figs. 10, 11, 12a, 12b).
Above the erosional remnants, MS-4 is dominated by more discontinuous seismic reflections (Fig. 23). Aside from a discontinuous higher amplitude reflection interval in the upper parts of MS-4 (roughly the slope equivalent of the O-marker or K130) seismic reflections cannot be correlated with confidence over distances that exceed 15 to 20 km. Local erosive surfaces are apparent, but in contrast to the unconformity near the base of MS-4, cannot be correlated regionally. Intervals of low amplitude reflections commonly have wedge-shaped geometries that border discontinuous brighter amplitude reflections. Well-developed shingling is common, particularly in higher amplitude seismic reflections. So too are intervals of chaotic high and low amplitude reflections. Some U-shaped high amplitude reflections stack vertically or laterally between wedge-shaped lower amplitude intervals, resembling the migrating channel-forms described in detail by Deptuck et al. (2003, 2007) and others. These seismic facies are consistent with curvi-linear to sinuous sand-prone submarine channels that stack and migrate between muddy levees. Low amplitude reflections are generally more continuous than the high amplitude reflections, but some continuous (over distances of 15 to 20 km) high amplitude reflections are also found along the bases of some channel-levee systems. These resemble more widespread sheet sands associated with channel-levee avulsions. On dip profiles, higher amplitude seismic facies are more continuous but a subtle shingling of reflections is still common. This implies that dip lines are crossing the length axis of largely channeled turbidite corridors. It is possible to map some of these leveed channel complexes even on 2D seismic data.
This interpreted submarine fan succession is referred to herein as the “Missisauga fan complex” (Fig. 23). It has only been calibrated by one well in the study area - Tantallon M-41. Two conventional cores are available from this well in MS-4. The shallowest core is in slope strata equivalent to the Upper Missisauga Formation, < 20 km seaward from a proposed Upper Missisauga shelf edge (shelf-edge trajectory 5, Fig. 22). It contains evidence for mass wasting with shear zones, ductile deformation, and blocks of failed material (see Piper et al., 2010), which is not surprising given its proximity to the Upper Missisauga shelf edge. The deepest core is through slope strata equivalent to the Lower Missisauga Formation (using the two-member division of Welsink et al., 1989), located about 42 km seaward of shelf-edge trajectory 4 (Fig. 22). The core shows the presence of numerous sharp-based thin-bedded turbidites composed of very fine grained to medium-grained sandstone (see Piper et al., 2010), including turbidites consistent with fine-grained overspill from levees (e.g. Piper and Deptuck, 1997).
The Missisauga fan complex is up to 1800 ms (twt) thick southwest of the underlying BSW. Above the BSW, the fan complex shows a general decrease in thickness from the west to the east across Parcels 1, 2, and 4 (compare profiles D1 and D3; Figs. 10, 11). In detail, several finer-scale thickness variations are apparent above the BSW. Late salt deflation below, or extension within, the BSW appears to have created accommodation space for several 10 to 20 km wide down-slope elongated depocenters, particularly above the western half of the BSW (Fig. 22). Similarly, rim synclines appear to have formed along isolated salt stocks that extend up from the underlying salt nappe, piercing MS-4 strata. These indicate active salt movement on the slope during MS-4. Inverted MS-3 turtles along the easternmost parts of the BSW appear to have formed positive-relief bathymetric elements that coincide with elongated thins within MS-4 slope stata (e.g. eastern part of profile S2 and S3; Fig. 12a, 12b). Several additional structures deform MS-4 strata on the slope. For example, broad folds are present on the upper slope, particularly obvious in profile D1, and a series of salt-cored folds is present on the lower slope (e.g. profiles D3, S1 and S2) (Figs. 11, 12a). There is no obvious thinning of MS-4 strata above these folds, indicating that folding post-dates the Missisauga fan complex. These folds are discussed in more detail in a later section.
MS-4 in the SWLS
In the eastern study area (Parcel 3), MS-4 thickens to the southeast where sediment progradation expelled salt from the landward parts of the SWLS. MS-4 reflections terminate in a quasi downlap fashion onto seaward leaning salt welds (e.g. profiles D4 and S4, Figs. 11, 12b) to produce well-defined expulsion rollovers (Hudec and Jackson, 2011). Seaward of these expulsion rollovers, salt contact maps indicate that the salt canopy along the SWLS was actively being expelled during MS-4 into the Southwest Laurentian Salt Canopy (Fig. 9). MS-4 strata accumulated in a series of minibasins above this amalgamated salt canopy (profile D4, Fig. 11).


