CANADA-NOVA SCOTIA OFFSHORE PETROLEUM BOARD


Formation Evaluation
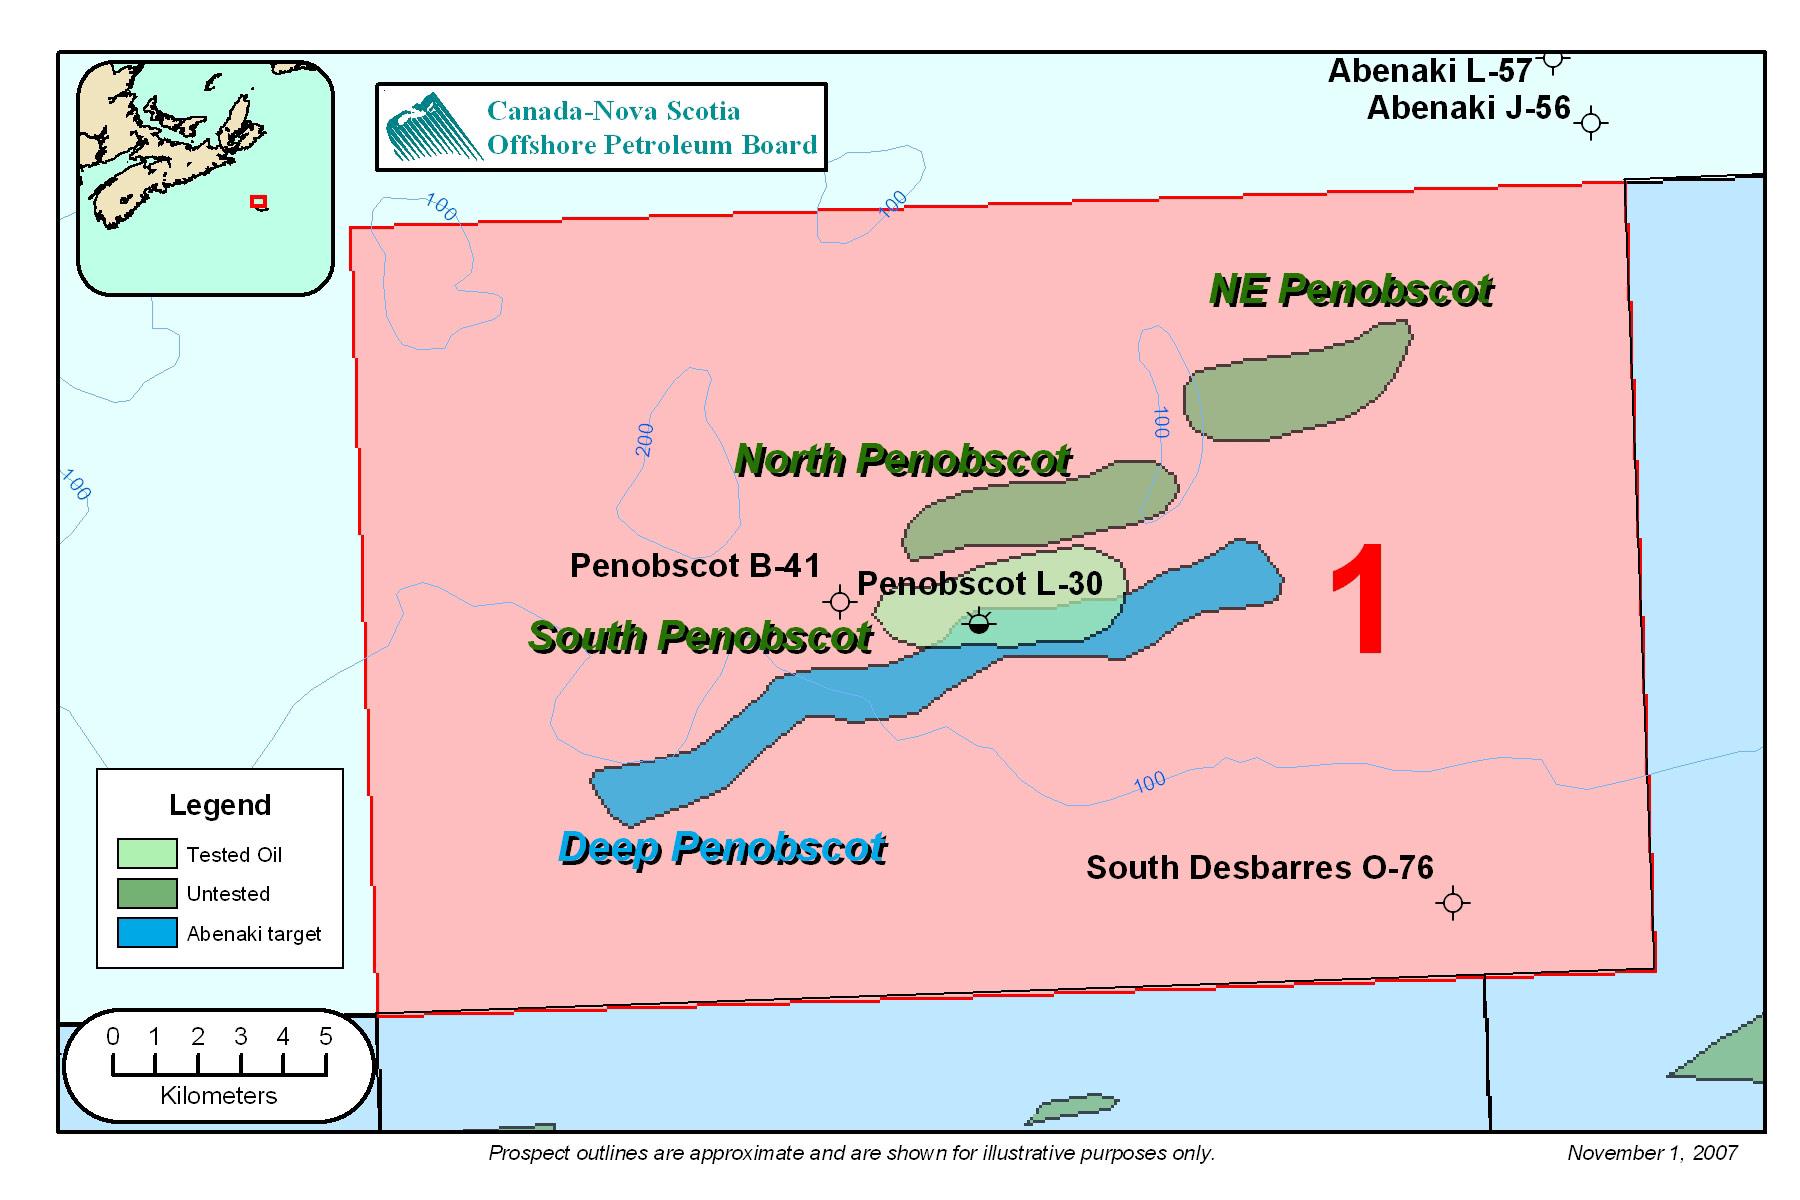
FIGURE: 13
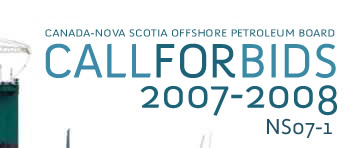
Three wells are located on Parcel 1: South Desbarres O-76, Penobscot L-30 and Penobscot B-41, (Figure 13). South Desbarres O-76 did not encounter any significant hydrocarbon bearing reservoirs and therefore did not warrant a detailed petrophysical assessment. A summary of the South Desbarres well appears below.
South Desbarres O-76 - Summary
Shell et al South Desbarres O-76 was spudded by the Vinland semi-submersible rig, in 69 m of water on April 16, 1984. The well is located 18km North of Sable Island and was drilled to test for the presence of hydrocarbons within sands of the early Cretaceous Missisauga and late Jurassic Mic Mac formations. The well reached TD within the Mic Mac formation at a depth of 6041 m. No significant hydrocarbon bearing zones were encountered and the well was abandoned on Oct. 13, 1984. A regional cross-section showing the correlation of several key geological horizons between Penobscot and South Desbarres is shown in Figure 14.
Penobscot – Formation Evaluation
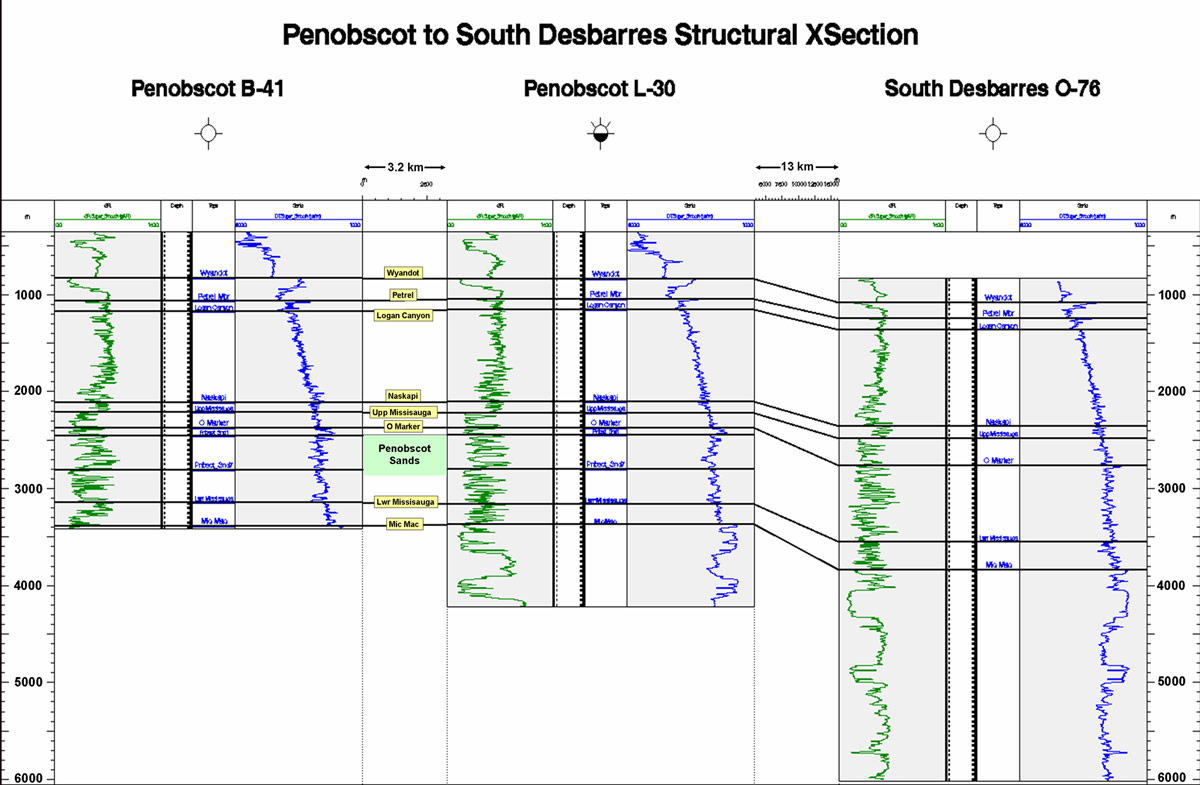
FIGURE: 14
Since hydrocarbons were encountered in Penobscot a detailed petrophysical assessment was conducted on both Penobscot L-30 and B-41.This assessment is presented below.
A complete suite of the primary logging measurements (i.e. GR, SP, Caliper, Density, Neutron, Sonic, Resisitivity) were acquired in both Penobscot L-30 and Penobscot B-41. Two conventional cores were cut in L-30, however both cores were cut well below the reservoir interval. In B-41 four conventional cores were cut within the Penobscot reservoir interval, see Figure 15. The Penobscot B-41 core intervals are listed below.
| Core# | Interval (m MD) |
Recovery |
| Core# 1 | 2499.4 – 2517.6m |
Rec. 17.4m |
| Core# 2 | 2642.6 – 2660.9m |
Rec. 14.3m |
| Core# 3 | 2660.9 – 2670.0m |
Rec. 8.2m |
| Core# 4 | 2699.0 – 2717.9m |
Rec. 3.05m |
Routine core analysis was conducted on the above cores. Average core porosity of the reservoir interval is 20%, with a maximum of 32%. Average permeability of the reservoir interval is 120 mD (arithmetic average) with a maximum of over 1000 mD.
No Drill Stem Tests (DSTs) were conducted in either Penobscot L-30 or B-41, however a number of Repeat Formation Tests (RFTs) were run in L-30. The RFT fluid recoveries, from the Penobscot L-30 reservoir sands, are listed below.
Penobscot L-30 – Fluids Recovered from RFT (Sands 1 - 5 Only) |
|||||
| Sand# | Depth (m) |
Oil/Condensate (cc) |
Gas (cu ft) |
Water (cc) |
Remarks |
| 1 | 2480.2 |
3400 cc cond. |
1.0 |
nil |
|
| 2 | 2504.8 |
900 cc oil |
Nil |
8,000 |
|
| 2 | 2509.4 |
nil |
Nil |
10,250 |
Sample taken below Oil-Water Contact (OWC) |
| 2 | 2509.4 |
nil |
Nil |
3,750 |
Sample taken below OWC |
| 3 | 2545.4 |
100 cc oil |
0.5 |
10,000 |
<1 m above OWC1 |
| 4 | 2639.3 |
3,800 cc cond. |
10.0 |
5,2002 |
|
| 4 | 2639.3 |
3,000 cc cond. |
5.0 |
Nil |
|
| 5 | 2700.5 |
nil |
Nil |
10,250 |
Transition zone3 |
| 5 | 2700.5 |
nil |
Nil |
3,750 |
Transition zone3 |
| 5 | 2700.8 |
nil |
Nil |
9,700 |
Transition zone3 |
1. This RFT recovered mainly water due to the proximity of the oil-water contact (OWC), i.e. RFT taken <1 m above OWC.
2. Both RFTs run at this depth recovered considerable condensate and gas. The water recovered from this RFT is likely mud filtrate and not formation water.
3. These RFTs were taken only 2 m above the interpreted OWC in sand 5. The upper portion of sand 5, at the L-30 location, is within the transition zone and has a high water saturation (Sw ~70%) resulting in water recovery on RFT.
FIGURE: 15
Seven (7) normally pressured hydrocarbon bearing sands were encountered in Penobscot L-30 within the middle Missisauga formation. As indicated by the RFT fluid recoveries, most sands appear to contain light oil/condensate and gas. It is unclear if the gas recovered from RFT is solution gas or free gas. Based on a petrophysical assessment of the zones it appears that light oil/condensate is the primary reservoir fluid.
A petrophysical assessment of the Penobscot L-30 and B-41 was conducted using available log, core and RFT data, see Figure 15. The Penobscot reservoir sands are wet in Penobscot B-41, however 7 hydrocarbon bearing zones were encountered in Penobscot L-30. Each sand, in L-30, was interpreted to have a separate log defined oil-water contact.The results of the Penobscot L-30 petrophysical assessment are summarized below.
Penobscot L-30 – Reservoir Properties |
|||||
| Sand | Top (m MD) |
Base (m MD) |
Net Pay (m TVD) |
Net Pay Por. (%) |
Sw (%) |
| 1 | 2477.6 |
2484.9 |
1.2 |
19 |
49 |
| 2 | 2503.0 |
2530.9 |
4.6 |
21 |
46 |
| 3 | 2542.0 |
2546.6 |
2.1 |
18 |
41 |
| 3A | 2558.5 |
2594.6 |
Wet |
N/A |
N/A |
| 4 | 2638.0 |
2669.0 |
4.3 |
19 |
45 |
| 5* | 2699.2 |
2758.5 |
01 |
N/A |
N/A |
| 6* | 2795.5 |
2805.4 |
01 |
N/A |
N/A |
| 7* | 2835.3 |
2912.8 |
01 |
N/A |
N/A |
* Penobscot L-30 was drilled on the flank of the South Penobscot structure and thus encountered relatively thin oil columns at the L-30 location. There is approximately 15 m of additional structural relief, for each of the Penobscot sands, updip of L-30. Sands 5 -7 have interpreted oil-water contacts within a few metres of the top of each sand. As a result, the top portion of these sands is transitional and has high water saturation (~70%). Sands 5 – 7 appear to have very thin (<0.5 m) oil pay over water at the very top of the each sand which supports the interpretation that the sands are transitional at the L-30 location.
return to top of page