


A total of 9 seismic markers were correlated across the study area (Figure 2.2). A velocity model was built to depth convert mapped seismic markers, to produce isopachs and correct a number of velocity artifacts produced by the Laurentian Channel and recent Quaternary glacial deposits. North Sydney F-24 and North Sydney P-05 (see Figure 4.2.1 for well locations) were used to generate the time-depth relationships for the model. These wells are 6 km apart and only penetrate the upper 1700 meters of the Sydney Basin which is shown to be up to 7 km thick. Although the wells are representative of only a small portion of the basins stratigraphic succession they do provide time-depth curves for the Mabou Group and shallower intervals. A linearly increasing velocity was used for the section below the well TD, Windsor and Horton groups, reaching a maximum of 4500 m/s at the D360 seismic marker.
The D360 seismic marker, as described earlier, is below the drilling depths of all offshore wells, and can be difficult to identify on some seismic lines. In the southern regions of Sydney Basin the exact boundary between the Horton Group (or older Devonian McAdams Lake Fm.) and basement is uncertain (Figure 4.1.4). South-southeast of the North Sydney wells the D360 horizon marks the base of reflectivity within faulted blocks. This is based on an assumption that the loss of reflectivity below this marker represents the Mira basement terrane, while layered reflections above the D360 are sedimentary rocks of the McAdams Lake Formation and/or Horton Group.
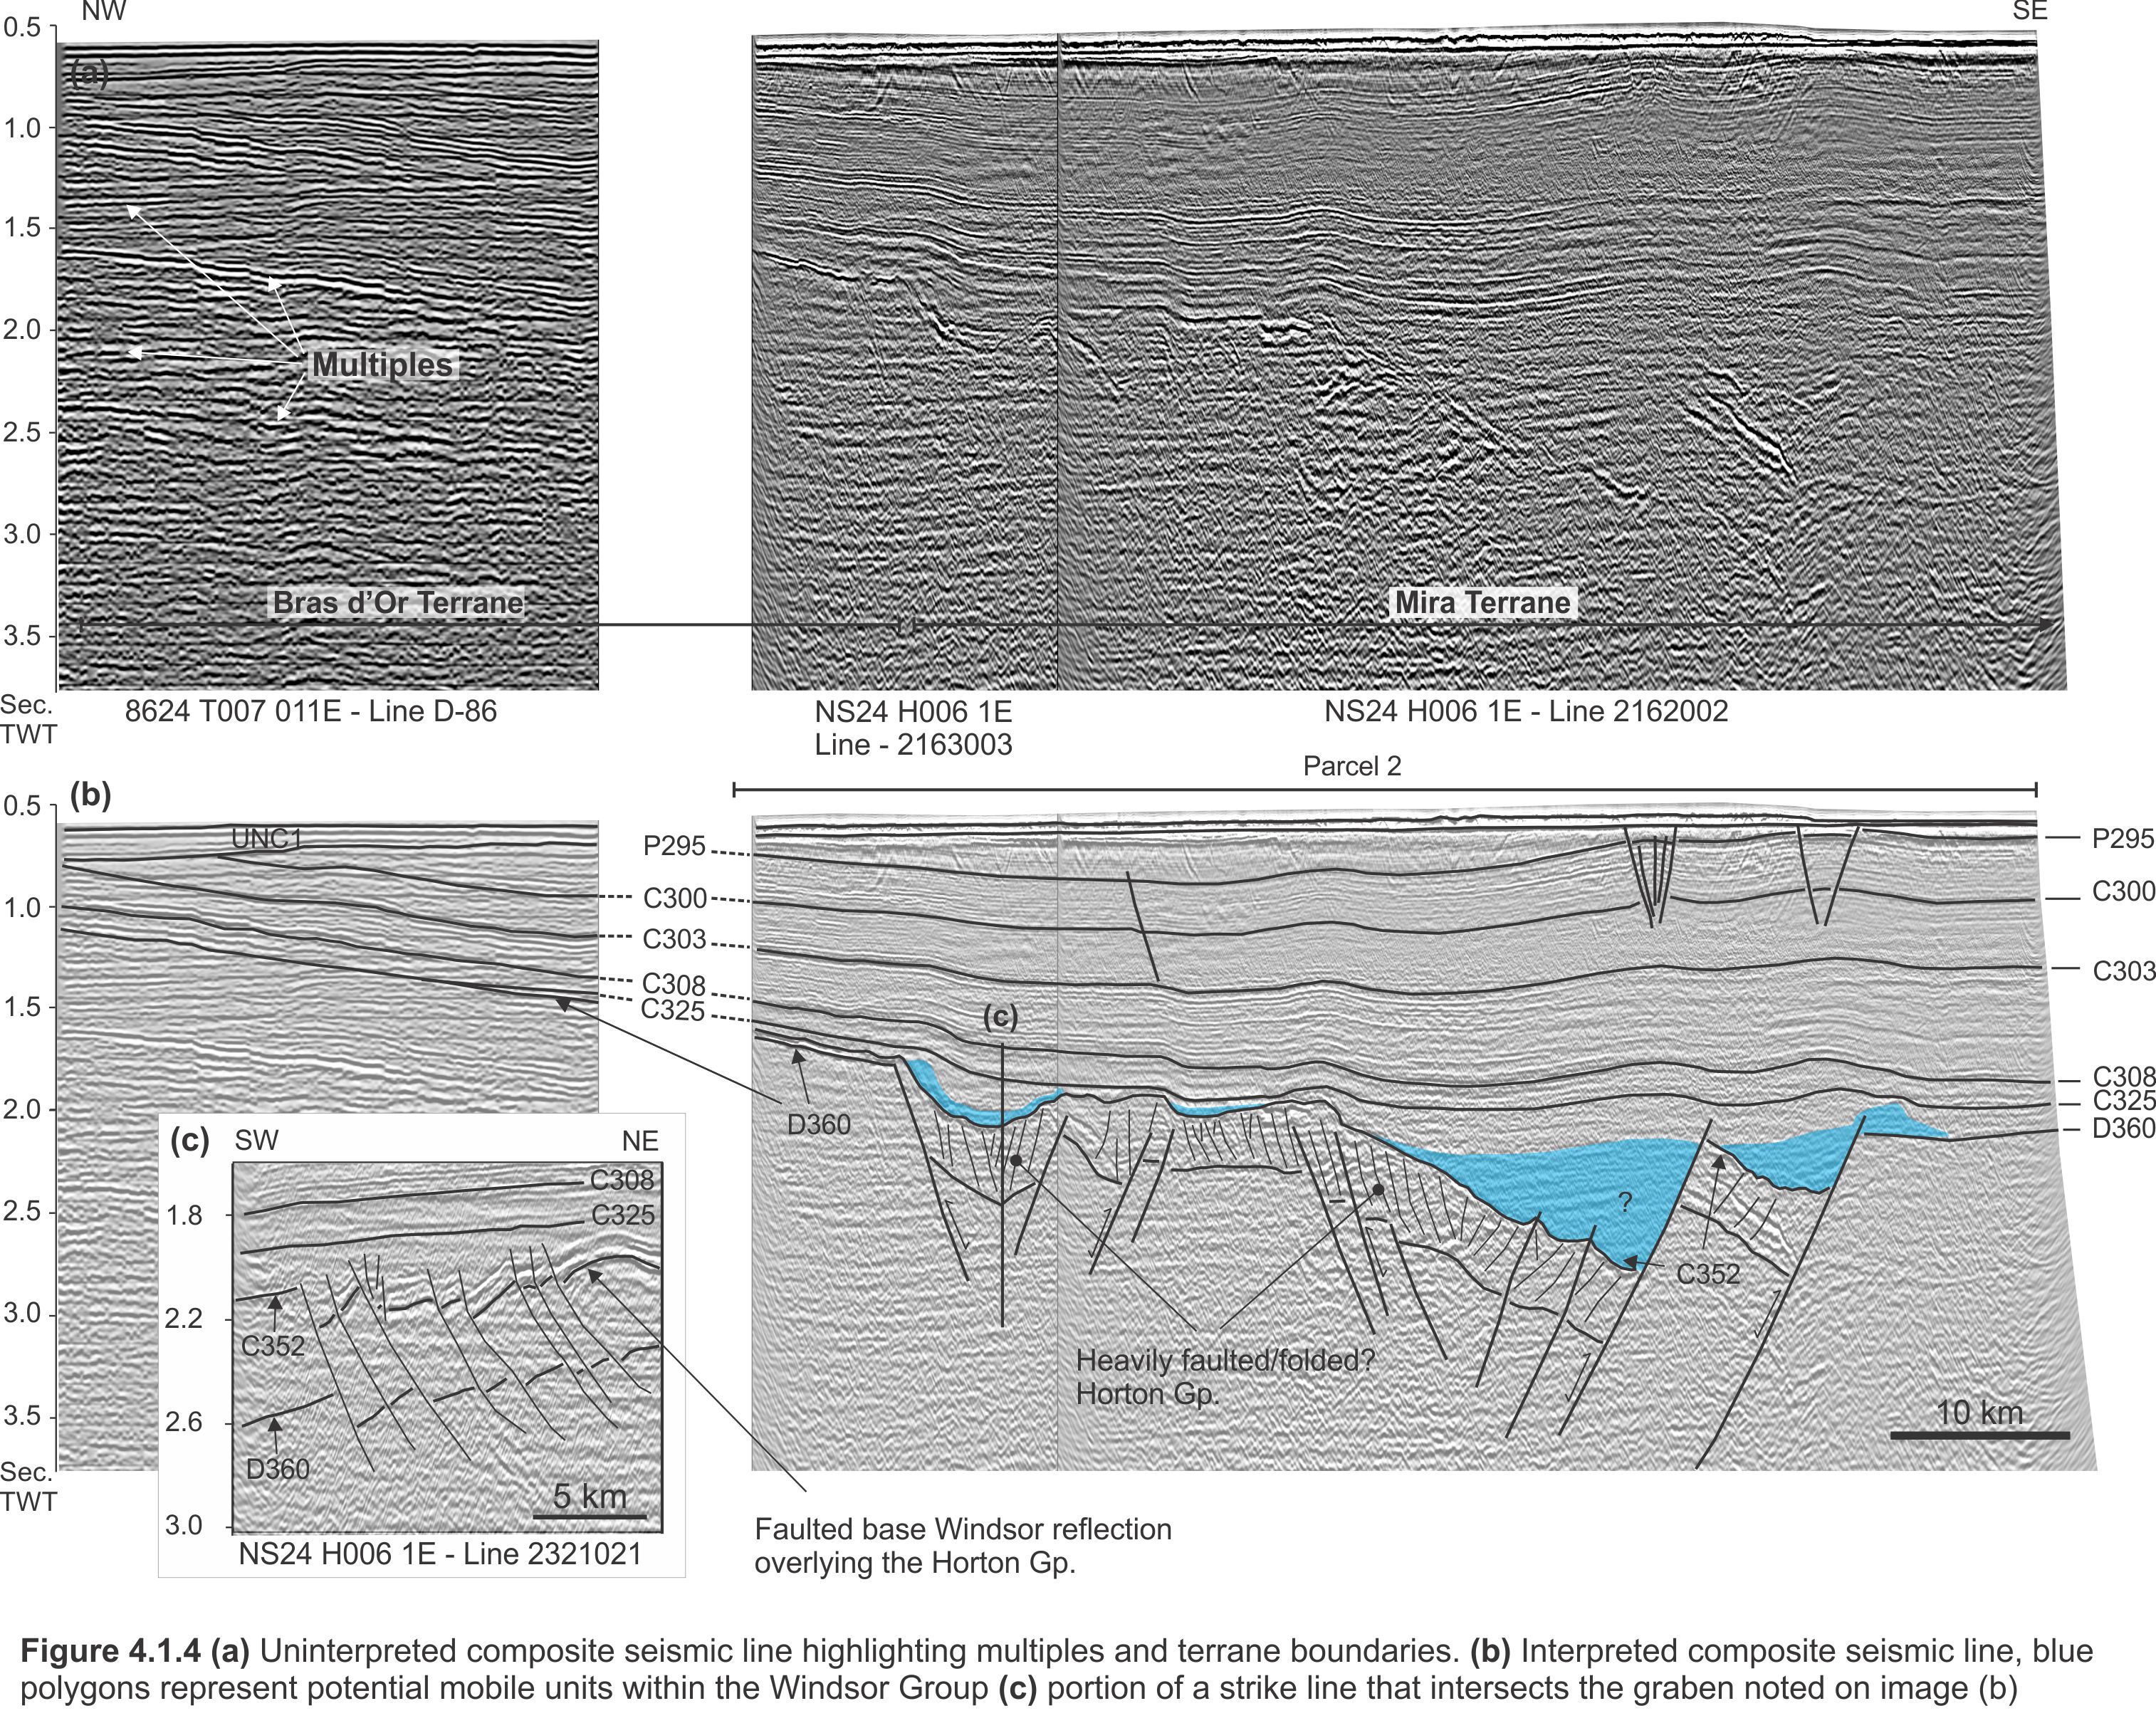
The C352 seismic horizon marks the Windsor-Horton contact (Figure 2.2). Where possible, it is interpreted at the base of a high-amplitude doublet that likely represents the basal anhydrites of the Windsor Group (Figure 4.1.4(c)). This basal Windsor reflection is well documented throughout the Maritimes Basin. The faulted/deformed nature of this doublet is consistent with interpretations that benefit from Windsor and Horton well control in other basins; e.g. Kennetcook Basin (Waldron et al., 2010) and Magdalen Basin (Durling and Marillier, 1990; Durling and Marillier, 1993). A potential alternate scenario is that the C352 marker represents the boundary between Horton and the Mira basement, and that any coherent reflections below C352 are actually meta-sedimentary rocks within the Mira Terrane. In this study, C352 is the preferred boundary between Windsor and Horton and when mapped as such, the distribution of the Horton Group is as shown in Figure 2.2. The Tournasian Horton deposits of predominantly lacustrine shales and sandstones are confined to the central and southern regions of Sydney Basin but may also be present within the CRG.
Figure 4.2.3 is a grid of the diachronous C325 seismic horizon. Near the wells, C325 represents the top of the Windsor Group, which although not not penetrated in the two the North Sydney wells is assumed to be just below their TDs. Away from the wells, the uncertainty for what this seismic horizon represents increases. The seismic marker stays above all identified salt diapirs, and below the Namurian unconformity, although the latter is not well defined on seismic. Therefore, in most scenarios the C325 is a top Windsor seismic horizon but in some areas may also represent the Namurian Unconformity and/or the top of the Mabou Group. The C325 to C352 (Windsor to Horton) interval is a marine unit, with deep marine evaporitic deposits at its base that transition upwards to interbedded, shallow water, bioclastic limestones, siltstones and shales near its transitional boundary with the overlying Mabou Group (Boehner and Giles, 2008).
Historically, it has been difficult to determine if Windsor Group salt is present within the offshore Sydney Basin. The existence of this Visean salt would improve confidence that there is adequate seal in place for trapping migrating hydrocarbons sourced from the underlying Horton shales. Webb (1973) noted a potential diapiric salt structure in the southern region of Sydney Basin (Figure 4.2.4). This diapir/salt wall is in Parcel 3 underlies an east-west trending fold visible on multiple structure maps (Figures 4.2.3 and 4.2.5) This diapiric feature is mappable across multiple seismic profiles and likely extends further to the east beyond the current seismic data coverage.
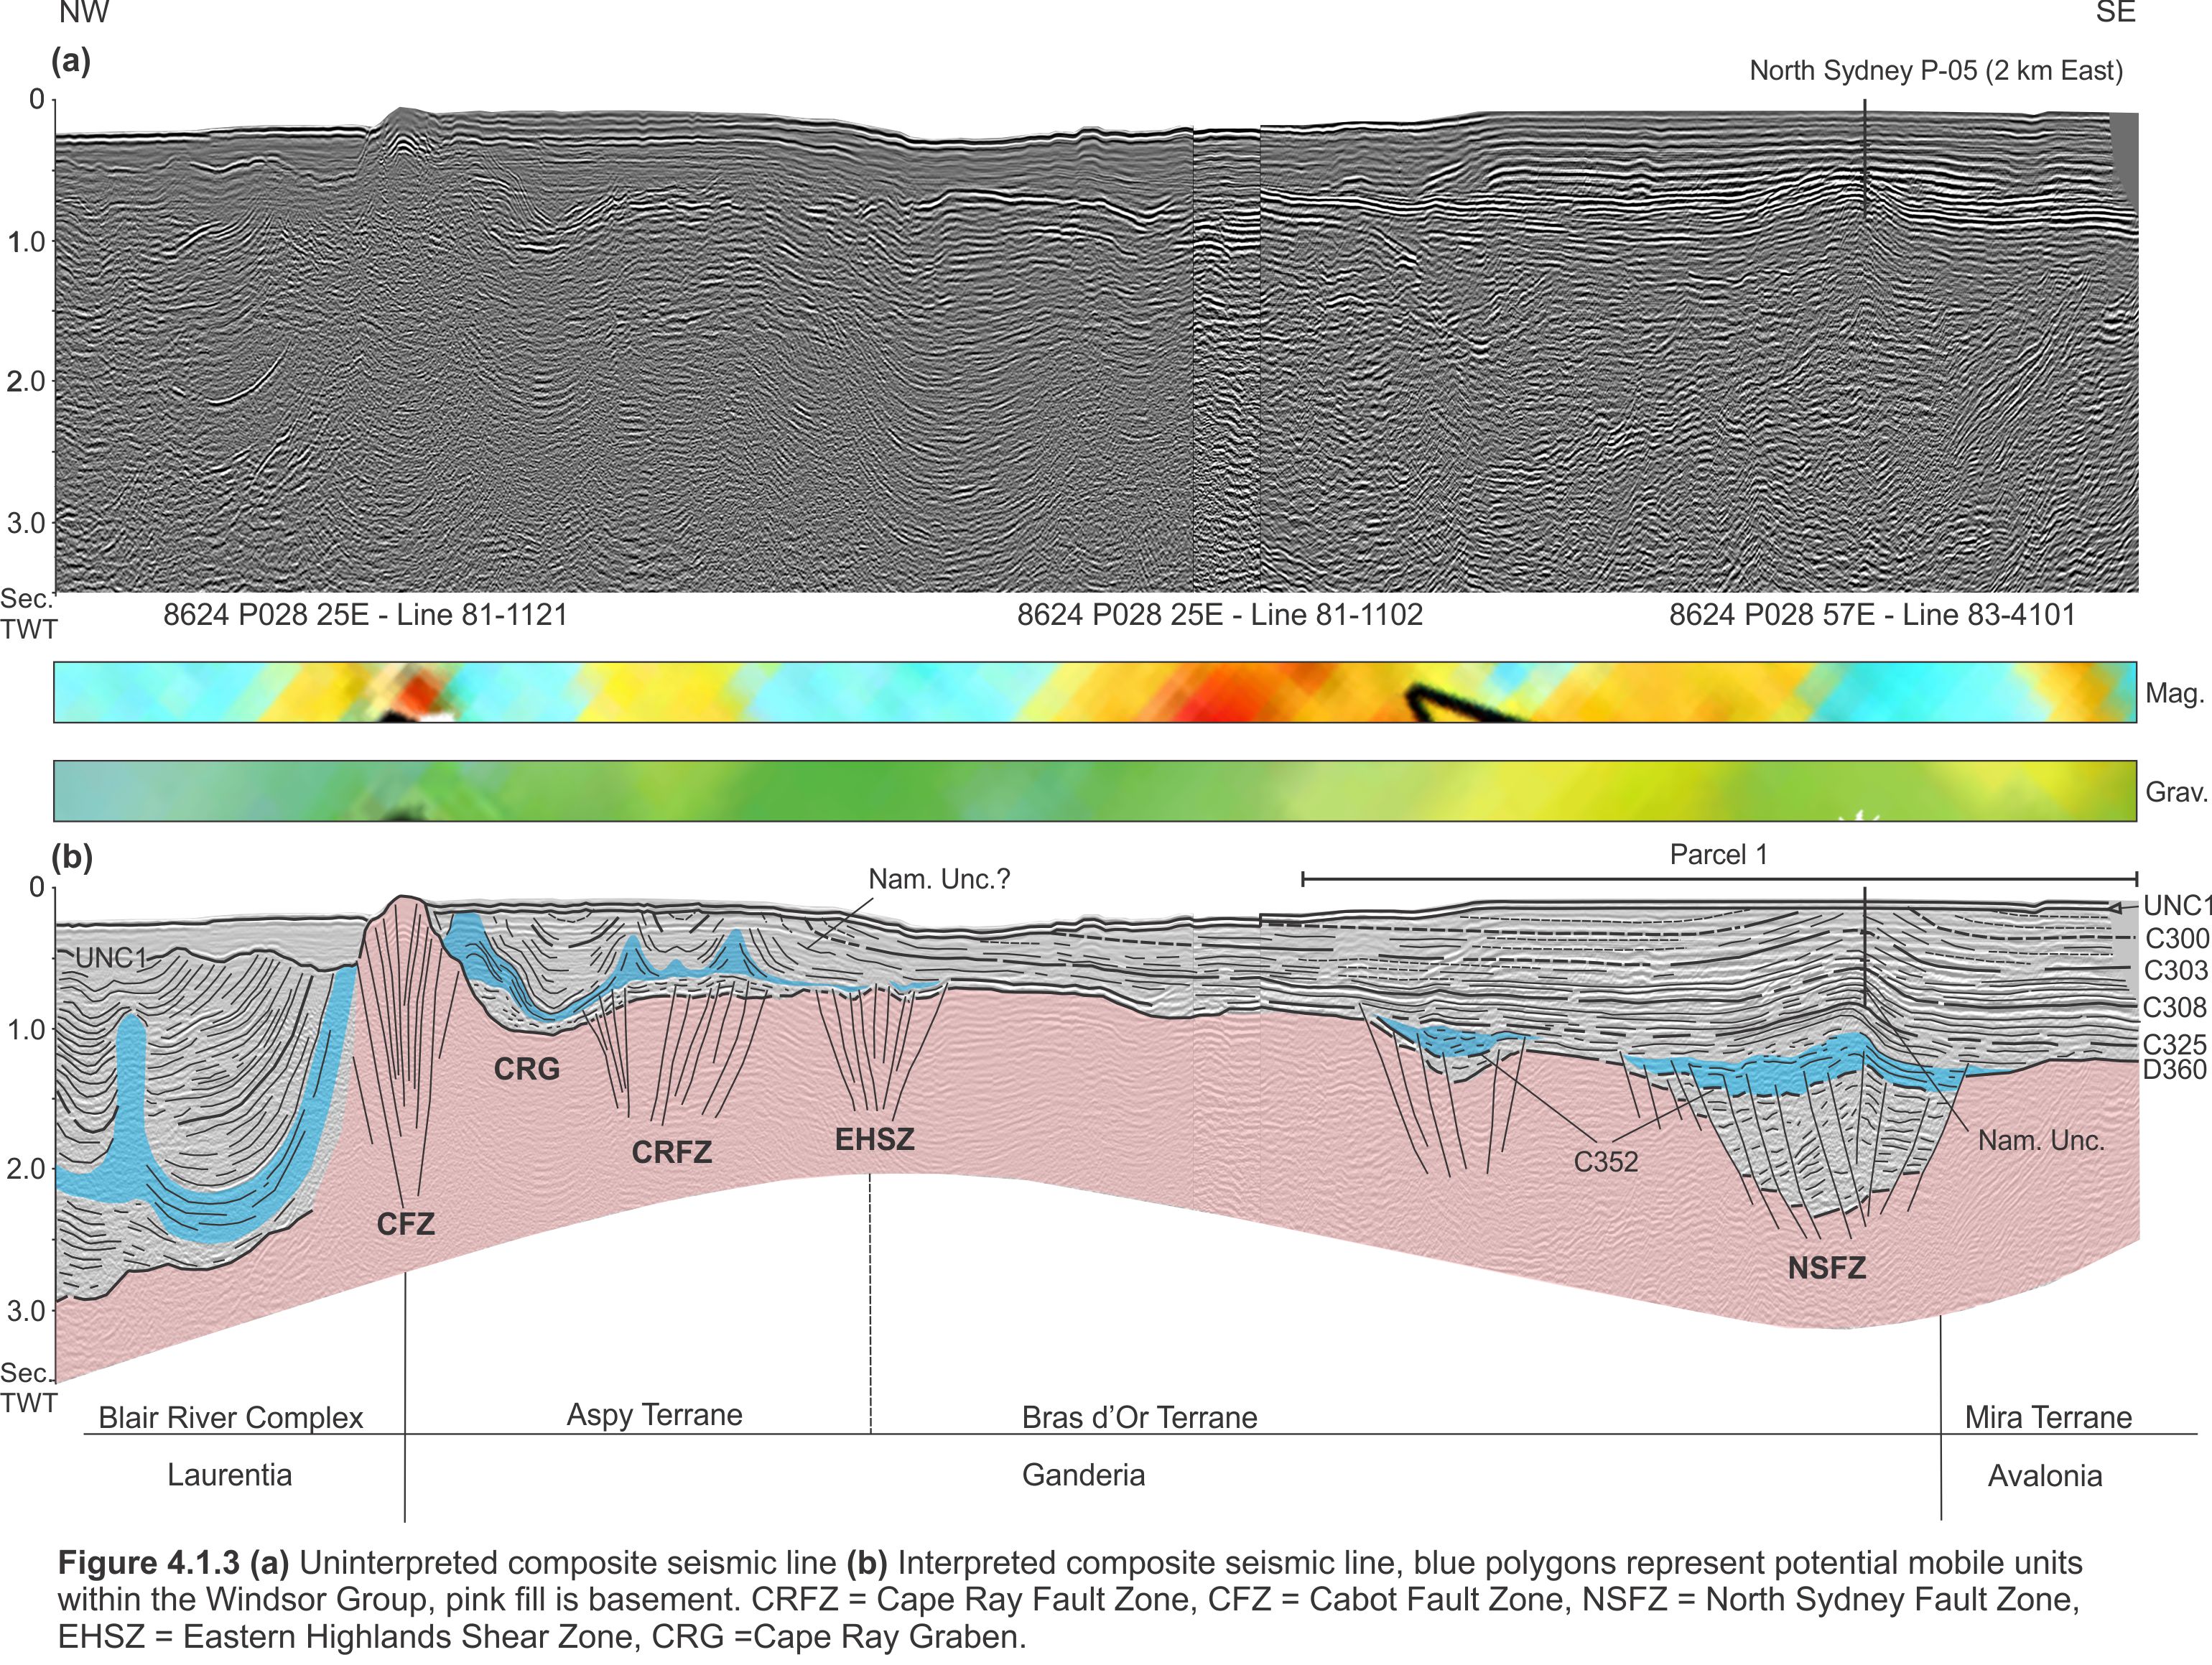
Throughout Parcels 1 and 2 Windsor salt is likely present but there is no strong evidence for diapiric structures. The Windsor Group here would have filled paleo-topographic lows created by earlier movement along faults that offset both the Mira basement and the Horton Group (Figures 4.1.3, 4.1.4 and 4.1.7 and 4.1.9). The blue polygons in these seismic profiles outline what appear to be mobile units with the Windsor Group. This unit is noted to deform, accommodate younger loading and in some cases rise up along bounding footwalls. All evidence that the strata within the blue polygons could be composed of a mobile facies (i.e. Windsor evaporites)
North of Parcels 1 and 2 but south of the CRFZ, diapiric salt structures, or any potential mobile Windsor units, are not recognized on the current seismic datasets. This is the region where the Bras d’Or and Aspy Terranes are quite shallow (perhaps existing as long-lived paleo-high?) and like the Horton Group, Windsor strata would likely be very thin to nonexistent here.
North of the basement high, probable salt diapirs/walls are interpreted in the CRG (Figures 4.1.3, 4.1.6 and 4.1.7). Dip lines through this graben show faint, folded and dipping reflections that are interpreted to represent folded strata overlying the diapirs (Figure 4.1.6). Previous authors’ interpretation in this graben follow the flat-lying reflections that are most likely a combination of conventional seafloor and peg-leg multiples; and thus not valid seismic events. The wide spacing of the dip-oriented seismic lines make this difficult to confirm on the industry seismic data. However, high resolution Geological Survey of Canada research shallow seismic data also cross this graben and were used to confirm the presence of dipping reflections (Figure 4.1.6(c)). This confirms that the dipping seismic reflections are present; and that previous interpretations on the “flat” reflections (multiples) are not representative of the geology in the CRG. These folded events can also be mapped to the northeast on neighboring seismic lines throughout the CRG which suggests these features are linear salt-cored walls that trend southwest-northeast.
Correlation to onshore outcrops also support the interpretation that these folded strata are likely diapirs. Line 81-1121 (the line shown in Figure 4.1.3) is a dip line located just offshore of Aspy Bay. Both Horton and Windsor groups outcrop in Aspy Bay, making it very plausible for the mobile units of the Windsor Group to be present a few kilometers offshore. Previous studies place Pennsylvanian strata at this elevation within the graben. A tie to the onshore outcrops in this scenario is less straightforward, and a large offset, north-south trending fault would be necessary. A fault of such large offset may be possible, but the required north-south trend is unlikely given the predominant east-west trend of the major strike-slip faults in the region.
The C308 seismic horizon marks the top of the South Bar Formation of the Morien Group (Figure 2.2 and 4.2.5). The South Bar Formation is a fluvial unit that is predominately composed of sandstones (Boehner and Giles, 2008). Some of these sandstone units are gas-charged in the anticline tested by the North Sydney wells. The South Bar Formation reaches burial depths of 4 km within Parcel 2 and shallows to the north and south. Locally, the uppermost parts of this surface is eroded over the crest of diapirs. The mid-lower section of the South Bar unit is still present overlying the salt diapir in Parcel 3 and is a potential reservoir unit here.
The C303 structure map for the comformable overlying Sydney Mines Formation is very similar to the South Bar (Figure 4.2.6). Its deepest burial depth is within Parcel 2 and it shallows to the north and south where it is eroded near the seafloor by an unconformity (UNC 1 on all figures). The precise age of this erosion is unknown, but it is no older than Permian and possibly as young as Mesozoic. It’s likely that this UNC 1 seismic horizon represents a merger of many different aged unconformities, potentially as old as Permian and others as young as the recent glacial events (Holocene).
The Pictou Group consists of alluvial deposits of red mudstones and sandstones (Figures 2.2 and 4.2.7). A precise “top” of the Pictou Group is not present in the wells but recent biostratigraphy (Weston et al, 2017) determined that this unit is present at the top of the North Sydney wells. The C300 seismic marker is within Permian aged strata and marks a notable seismic boundary between a higher amplitude, channelized unit (above C300) and a low amplitude seismic facies with predominantly parallel seismic reflectors (below C300) (Figure 4.1.4). Within this study, the C300 arbitrarily represents the Top of the Pictou Group, while the shallower P285 represents a second intra-Permian unit, with a distinctly different seismic facies (Figure 4.2.8). This upper interval (P295-C300) may be equivalent to the Permian sandstones identified in multiple Magdalen Basin wells by Giles and Utting (1999). The P295 is only present/preserved in the central Sydney Basin, within Parcel 2 and at the eastern edge of Parcel 1.
Isopach Maps and Summary of Tectonic Events
The total thickness map shows deep depocenters (7 km or more) in the south-central part of Sydney Basin (Figure 4.2.9 a, b). The initial strata within these depocenters are the Late Devonian to Early Carboniferous McAdams Lake, Horton and Windsor groups. These formations infilled the rifted Mira (Avalon) Terrane basement rocks. The early rifting, that is primarily focused in the Mira Terrane is likely related to the middle-late Devonian Acadian orogeny (Pascucci et al., 2000). The post-Windsor Late Carboniferous successions of fluvial, floodplain and alluvial deposits subsequently filled the basin once the Acadian related rifted topography had been infilled. Localised depocenters are not present in the Late-Carboniferous, and thickness maps of these sequences display a broad-scale regional thickening to the south (Figure 4.2.10). This thickening trend is likely related to both regional susidence (thermal relaxation?) and salt withdrawal. This Late Carboniferous loading of underlying Windsor units formed the east-west trending salt wall that is present in the southern part of the basin.
An apparent lack of thinning near the crests of multiple folds on seismic lines and late Carboniferous thickness maps, is evidence that this inversion-related folding throughout the basin occurred very late, likely in the Permian or later (Figures 4.2.3, 4.2.4, 4.2.7, 4.2.9 a,b and 4.2.10). The mechanism for this late inversion event is most likely a strike-slip and/or reverse reactivation of the older Acadian faults, possibly related to the initial phases of rifting in the Central Atlantic region starting in the Middle Triassic.