


print this page
Parcel 1 Exploration Potential
Figure 11
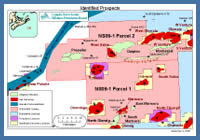
Prospect Map
Prospect Map
The Marmora gas field and the undrilled prospects, South Marmora, East Marmora and North Glenelg are located on Parcel #1, figure 11 and are described below.
Marmora Gas Field
Marmora C-34 is located 23 km south of Sable Island and was drilled by Shell in 1972. The well was drilled to test for hydrocarbons in early Cretaceous Missisauga Formation stacked fluvial deltaic sands trapped within a rollover anticline.
Figure 12
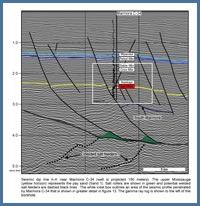
Seismic dip line A-A’ near Marmora C-34 (well is projected 150 meters). The upper
Missisauga (yellow horizon) represents the pay sand (Sand 1). Salt rollers are shown in green and potential welded salt feeders are dashed black lines. The white inset box outlines an area of the seismic profile penetrated by Marmora C-34 that is shown in greater detail in figure 13. The gamma ray log is shown to the left of the borehole.
The Marmora structure is a fault bounded rollover anticline created by sediment induced motion of the deep underlying salt, figures 12 and 13. The main Marmora fault is a large seaward dipping down-to-the-basin growth fault which soles into allochthonous salt. A smaller landward dipping fault less than 1 km south of the main Marmora fault defines the northern limit of Sand 1 gas pool. A narrow graben is present between these two faults. The Marmora structure has a number of crestal faults caused by salt movement at depth. While the throw is generally minor, there is sufficient offset in some crestal faults to allow sand to sand juxtaposition, creating a spill point for the Sand 1 gas pool, figure 14.
The Sand 1 trap at Marmora is a combination of 3-way dip and fault dependent closure. Sand 1 is located at the top of the early Cretaceous upper Missisauga Formation directly below the thick Naskapi shale. The presence of the thick overlying Naskapi shale in addition to providing top seal also permits lateral seal along the northern Marmora fault. The trap configuration at Marmora is similar to the Onondaga and North Triumph gas discoveries which both have over 30 m of net gas pay at the top of the Missisauga, figures 15 and 16.
Figure 13
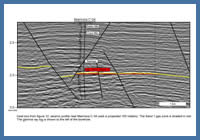
Inset box from figure 12, seismic profile near Marmora C-34 (well is projected 150 meters). The Sand 1 gas zone is shaded in red. The gamma ray log is shown to the left of the borehole.
Inset box from figure 12, seismic profile near Marmora C-34 (well is projected 150 meters). The Sand 1 gas zone is shaded in red. The gamma ray log is shown to the left of the borehole.
No well tests were conducted in Marmora C-34 but well logs and wireline tester samples confirmed the presence of a high quality gas bearing, normally pressured, reservoir sand in the upper Missisauga Formation (Sand 1). Sand 1 was the only significant hydrocarbon bearing zone encountered in Marmora C-34. The sand is a coarsening upward shoreface sand, that is fine to coarse grained, subangular to rounded and medium to well sorted. Sand 1 has very good to excellent reservoir properties with porosities up to 27% (average 21%) and estimated permeabilities up to 400 mD. The sand has a log defined gas-water contact that is consistent with the recovered wireline tester samples, figure 17. The results of the Marmora C-34 petrophysical assessment are summarized below.
Marmora C-34 - Petrophysical Results Summary |
||||||
Well Name |
Zone |
Top (m MD) |
Base (m MD) |
Net Pay
(m TVD) |
Average Porosity (%) |
Average Sw (%) |
Marmora C-34 |
Sand 1 |
3132.8 |
3176.3 |
9.4 |
21 |
33 |
Figure 14
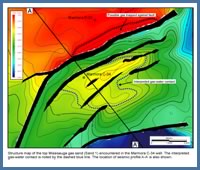
Structure map of the top Missisauga gas sand (Sand 1) encountered in the Marmora C-34 well. The interpreted gas-water contact is noted by the dashed blue line. The location of seismic profile A-A’ is also shown.
Structure map of the top Missisauga gas sand (Sand 1) encountered in the Marmora C-34 well. The interpreted gas-water contact is noted by the dashed blue line. The location of seismic profile A-A’ is also shown.
The CNSOPB conducted a probabilistic resource assessment of the Marmora gas field. The most likely area was determined by projecting the interpreted gas water contact (GWC) onto the Sand 1 (upper Missisauga) time structure map which results in an area of 8 km², figure 14. The minimum area was determined by reducing the most likely area by 10% (minimum area 7.2 km²) to allow for mapping uncertainty. There is a small fault dependent closure, with an area of approximately 2 km², located one kilometre south of Marmora P-35. This closure is interpreted to contain upper Missisauga sand(s) trapped against the footwall of the main Marmora growth fault, figure 14. The maximum area was assigned by lowering the interpreted GWC nine metres to the level of the water-up-to, in Sand 1, and adding the area of the small fault dependent closure described above. This resulted in a maximum area of 12.5 km² for the Marmora Sand 1 gas pool. The other probabilistic input parameters, i.e. net pay, porosity, hydrocarbon saturation etc. were based on the results of the petrophysical analysis with consideration given to the position of the Marmora C-34 well on the structure.
The results of the probabilistic resource assessment for the Marmora gas field are tabulated below.
Marmora – Original Gas in Place |
|||
P90 (E9M3) |
P50 (E9M3) |
P10 (E9M3) |
Mean (E9M3) |
3.2 |
4.1 |
5.3 |
4.2 |
P90 (Bcf) |
P50 (Bcf) |
P10 (Bcf) |
Mean (Bcf) |
113 |
145 |
187 |
148 |
Marmora – Recoverable Gas in Place |
|||
P90 (E9M3) |
P50 (E9M3) |
P10 (E9M3) |
Mean (E9M3) |
2.2 |
2.9 |
3.7 |
2.9 |
P90 (Bcf) |
P50 (Bcf) |
P10 (Bcf) |
Mean (Bcf) |
78 |
102 |
132 |
104 |
Undrilled Prospects
Figure 15
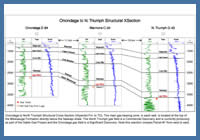
Onondaga to North Triumph Structural Cross-Section (Wyandot Fm. to TD). The main gas bearing zone, in each well, is located at the top of the Missisauga Formation directly below the Naskapi shale. The North Triumph gas field is a Commercial Discovery and is currently producing as part of the Sable Gas Project and the Onondaga gas field is a Significant Discovery. Note this xsection crosses Parcel #1 from west to east.
Onondaga to North Triumph Structural Cross-Section (Wyandot Fm. to TD). The main gas bearing zone, in each well, is located at the top of the Missisauga Formation directly below the Naskapi shale. The North Triumph gas field is a Commercial Discovery and is currently producing as part of the Sable Gas Project and the Onondaga gas field is a Significant Discovery. Note this xsection crosses Parcel #1 from west to east.
The CNSOPB has identified three undrilled prospects on Parcel #1. These prospects are located in the southern portion of the parcel within seven kilometers of the Marmora gas field, and are named, North Glenelg, South Marmora and East Marmora, figure 18. It should be noted that other prospects are likely present on the parcel which further seismic mapping may uncover. These prospects may include plays such as subtle drapes over basement highs or stratigraphic traps. The prospects identified by the CNSOPB are discussed below.
South Marmora
The South Marmora prospect is located approximately two kilometers southeast of the Marmora gas field. The structure is a fault bounded rollover anticline created by sediment induced motion of the underlying salt, figure 19. The South Marmora trap is defined by simple closure that is interpreted to extend from the early Cretaceous lower Missisauga to the mid to late Jurassic Mic Mac Formation. Within the Missisauga to Mic Mac target interval the reservoir sands are interpreted to be stacked deltaic sands directly analogous to those encountered in nearby wells.
North Glenelg
Figure 16
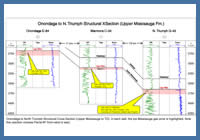
Onondaga to North Triumph Structural Cross-Section (Upper Missisauga to TD). In each well, the top Missisauga gas zone is highlighted. Note this xsection crosses Parcel #1 from west to east.
Onondaga to North Triumph Structural Cross-Section (Upper Missisauga to TD). In each well, the top Missisauga gas zone is highlighted. Note this xsection crosses Parcel #1 from west to east.
Figure 17
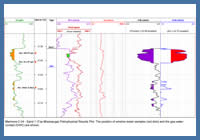
Marmora C-34 -Sand 1 (Top Missisauga) Petrophysical Results Plot. The position of wireline tester samples (red dots) and the gas-water contact (GWC) are shown.
Marmora C-34 -Sand 1 (Top Missisauga) Petrophysical Results Plot. The position of wireline tester samples (red dots) and the gas-water contact (GWC) are shown.
Approximately four kilometres to the southwest of South Marmora is the North Glenelg prospect. The North Glenelg structure is updip from South Marmora, therefore any excess gas spilling from South Marmora would migrate through a structural saddle and charge North Glenelg, figure 18. The primary target intervals at North Glenelg are Missisauga to Mic Mac stacked deltaic sands. These sands are believed to be trapped, to the south, against the footwall of the Glenelg bounding fault, figure 19. It should be noted the CNSOPB has declared the Glenelg gas field to be a Significant Discovery and while it is currently not on production it was approved for development as part of the six field Sable Offshore Energy Project.
East Marmora
Figure 18
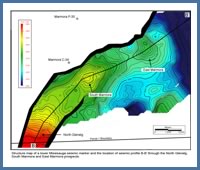
Structure map of a lower Missisauga seismic marker and through the North Glenelg, South Marmora and East Marmora prospects. the location of seismic profile B-B’
Structure map of a lower Missisauga seismic marker and through the North Glenelg, South Marmora and East Marmora prospects. the location of seismic profile B-B’
The East Marmora prospect is located approximately five kilometers northeast of the South Marmora prospect. The structure is a fault bounded rollover anticline created by sediment induced motion of the underlying salt, figure 18. The East Marmora trap is defined by simple and fault dependent closure that is interpreted to extend from the early Cretaceous lower Missisauga to the mid to late Jurassic Mic Mac Formation. Within the Missisauga to Mic Mac target interval the reservoir sands are interpreted to be stacked deltaic sands. East Marmora is downdip and along strike from both South Marmora and North Glenelg. As a result, any excess gas spilling from East Marmora would migrate updip into South Marmora, and could eventually spill into North Glenelg, figure 19.
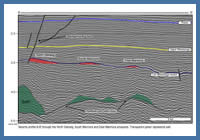
Figure 19
Seismic profile B-B’ through the North Glenelg, South Marmora and East Marmora prospects. Transparent green represents salt.
Seismic profile B-B’ through the North Glenelg, South Marmora and East Marmora prospects. Transparent green represents salt.
For the Marmora gas field and the above undrilled prospects, gas prone shales of the mid Jurassic to early Cretaceous Verrill Canyon Formation are the interpreted source rocks. The gas generated from these intervals is believed to have migrated along fault planes until it was trapped in the above structures. The number of significant and commercial discoveries in the Sable Subbasin sourced from Verrill Canyon shales clearly demonstrates the effectiveness of these source rocks.