


Regional Geoscience Parcel 1 Figures
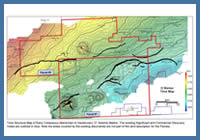
Figure 10
Time Structure Map of Early Cretaceous (Barremian to Hauterivian) ‘O’ Seismic Marker. The existing Significant and Commercial Discovery Areas are outlined in blue. Note the areas covered by the existing discoveries are not part of the land description for the Parcels.
Time Structure Map of Early Cretaceous (Barremian to Hauterivian) ‘O’ Seismic Marker. The existing Significant and Commercial Discovery Areas are outlined in blue. Note the areas covered by the existing discoveries are not part of the land description for the Parcels.
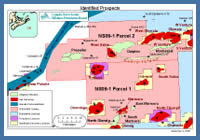
Figure 11
Prospect Map
Prospect Map
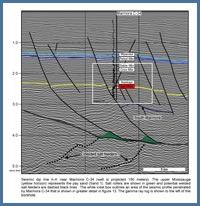
Figure 12
Seismic dip line A-A’ near Marmora C-34 (well is projected 150 meters). The upper Missisauga (yellow horizon) represents the pay sand (Sand 1). Salt rollers are shown in green and potential welded salt feeders are dashed black lines. The white inset box outlines an area of the seismic profile penetrated by Marmora C-34 that is shown in greater detail in figure 13. The gamma ray log is shown to the left of the borehole.
Seismic dip line A-A’ near Marmora C-34 (well is projected 150 meters). The upper Missisauga (yellow horizon) represents the pay sand (Sand 1). Salt rollers are shown in green and potential welded salt feeders are dashed black lines. The white inset box outlines an area of the seismic profile penetrated by Marmora C-34 that is shown in greater detail in figure 13. The gamma ray log is shown to the left of the borehole.
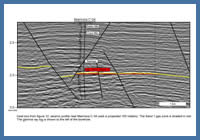
Figure 13
Inset box from figure 12, seismic profile near Marmora C-34 (well is projected 150 meters). The Sand 1 gas zone is shaded in red. The gamma ray log is shown to the left of the borehole.
Inset box from figure 12, seismic profile near Marmora C-34 (well is projected 150 meters). The Sand 1 gas zone is shaded in red. The gamma ray log is shown to the left of the borehole.
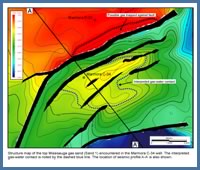
Figure 14
Structure map of the top Missisauga gas sand (Sand 1) encountered in the Marmora C-34 well. The interpreted gas-water contact is noted by the dashed blue line. The location of seismic profile A-A’ is also shown.
Structure map of the top Missisauga gas sand (Sand 1) encountered in the Marmora C-34 well. The interpreted gas-water contact is noted by the dashed blue line. The location of seismic profile A-A’ is also shown.
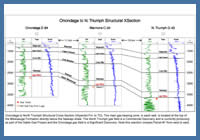
Figure 15
Onondaga to North Triumph Structural Cross-Section (Wyandot Fm. to TD). The main gas bearing zone, in each well, is located at the top of the Missisauga Formation directly below the Naskapi shale. The North Triumph gas field is a Commercial Discovery and is currently producing as part of the Sable Gas Project and the Onondaga gas field is a Significant Discovery. Note this xsection crosses Parcel #1 from west to east.
Onondaga to North Triumph Structural Cross-Section (Wyandot Fm. to TD). The main gas bearing zone, in each well, is located at the top of the Missisauga Formation directly below the Naskapi shale. The North Triumph gas field is a Commercial Discovery and is currently producing as part of the Sable Gas Project and the Onondaga gas field is a Significant Discovery. Note this xsection crosses Parcel #1 from west to east.
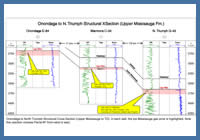
Figure 16
Onondaga to North Triumph Structural Cross-Section (Upper Missisauga to TD). In each well, the top Missisauga gas zone is highlighted. Note this xsection crosses Parcel #1 from west to east.
Onondaga to North Triumph Structural Cross-Section (Upper Missisauga to TD). In each well, the top Missisauga gas zone is highlighted. Note this xsection crosses Parcel #1 from west to east.
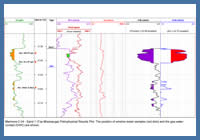
Figure 17
Marmora C-34 -Sand 1 (Top Missisauga) Petrophysical Results Plot. The position of wireline tester samples (red dots) and the gas-water contact (GWC) are shown.
Marmora C-34 -Sand 1 (Top Missisauga) Petrophysical Results Plot. The position of wireline tester samples (red dots) and the gas-water contact (GWC) are shown.
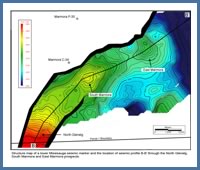
Figure 18
Marmora C-34 -Sand 1 (Top Missisauga) Petrophysical Results Plot. The position of wireline tester samples (red dots) and the gas-water contact (GWC) are shown.
Marmora C-34 -Sand 1 (Top Missisauga) Petrophysical Results Plot. The position of wireline tester samples (red dots) and the gas-water contact (GWC) are shown.
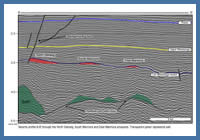
Figure 19
Seismic profile B-B’ through the North Glenelg, South Marmora and East Marmora prospects. Transparent green represents salt.
Seismic profile B-B’ through the North Glenelg, South Marmora and East Marmora prospects. Transparent green represents salt.