


Subregional Geology
Subregional Geological Overview
Outer shelf depositional systems
Breaching the shelf-edge and the transport of Lower Cretaceous sands into deepwater
Deepwater depositional systems in the areas of Parcels 1 and 2
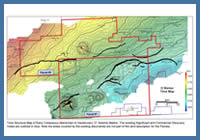
FIGURE: 10
Schematic paleogeography map for the Jurassic, showing the Abenaki carbonate platform along the edge of the stable continental margin. Three main facies zones are shown, corresponding to an inner low energy shelf, an outer high energy shelf, and the steep foreslope that extends into deepwater (see Kidston et al., 2005 for further details). Coeval with the development of the carbonate bank was the deposition of the Upper Jurassic Mic Mac Formation and its equivalents, consisting of a mix of clastics and carbonates that are thickest in the NE corner of the figure. Significant growth faulting and salt mobilization took place while the Mic Mac Formation was deposited. In the areas of Parcels 1 and 2, a time-thickness map for the J350 and J280 markers shows the distribution of the earliest minibasins above autochthonous salt. The minibasins are assumed to contain Jurassic strata composed of the deepwater equivalents of the Mic Mac Formation, as well as strata equivalent to the Mohican Formation. Sediment input into deepwater is presumed to be normal or sub-normal to the steep Abenaki slope. Salt outlines on this map are highly schematic. See text for details.
Schematic paleogeography map for the Jurassic, showing the Abenaki carbonate platform along the edge of the stable continental margin. Three main facies zones are shown, corresponding to an inner low energy shelf, an outer high energy shelf, and the steep foreslope that extends into deepwater (see Kidston et al., 2005 for further details). Coeval with the development of the carbonate bank was the deposition of the Upper Jurassic Mic Mac Formation and its equivalents, consisting of a mix of clastics and carbonates that are thickest in the NE corner of the figure. Significant growth faulting and salt mobilization took place while the Mic Mac Formation was deposited. In the areas of Parcels 1 and 2, a time-thickness map for the J350 and J280 markers shows the distribution of the earliest minibasins above autochthonous salt. The minibasins are assumed to contain Jurassic strata composed of the deepwater equivalents of the Mic Mac Formation, as well as strata equivalent to the Mohican Formation. Sediment input into deepwater is presumed to be normal or sub-normal to the steep Abenaki slope. Salt outlines on this map are highly schematic. See text for details.
Subregional Geological Overview
Four paleogeography maps for the subregional study area, presented in Figures 10, 11, 12, and 13, were constructed using available seismic and well data. These semi-schematic maps provide an overview of the shelf depositional systems and corresponding deepwater depositional systems (studied primarily in the 4530 km2 Thrumcap 3D seismic survey area CNSOPB Program # NS24-S6-1E/2E). Improved understanding of sand distribution and timing on the outer shelf, combined with the identification of potential conduits for transporting coarse clastics beyond the shelf-edge, should help evaluate the potential for sand-prone reservoirs in the deepwater depositional systems in Parcels 1 and 2 of the NS08-2 Call for bids.
Outer shelf depositional systems
Although there is strong evidence for Jurassic-aged minibasins loading autochthonous salt in the areas of Parcels 1 and 2 (e.g. Figure 10 - likely containing Mohican to Mic Mac equivalent strata), the most important reservoir intervals are interpreted to be Lower Cretaceous deepwater turbidite successions supplied by the sand-prone Missisauga to lower Logan Canyon formations (Figure 14). Coarse clastics from these formations were encountered in several wells on the shelf located 60 to 120 km NNE of the parcels (e.g. Queensland M-88, Alma K-85, Alma F-67, Demascota G-32, Musquodoboit E-23, Cree I-34, Cree E-35, Merigomish C-52, and Oneida O-25).
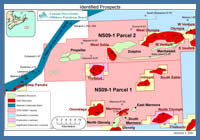
FIGURE: 11
Schematic paleogeography map for the lowermost Cretaceous. The map shows the southward progradation of the sand-prone Lower Missisauga Formation along the Jurassic carbonate bank. Several canyons are present near the outer shelf, and these are presumed to have supplied clastics to the south and southwest where the J280 to K230 time-thickness map is thickest. Clastics are also inferred to have been supplied down the carbonate slope. This interpretation is based in part on an amplitude extraction from the J280 marker which appears to show a series of high amplitude interfingering submarine fans sourced from the NW. Salt outlines on this map are highly schematic. Refer to text for details.
Schematic paleogeography map for the lowermost Cretaceous. The map shows the southward progradation of the sand-prone Lower Missisauga Formation along the Jurassic carbonate bank. Several canyons are present near the outer shelf, and these are presumed to have supplied clastics to the south and southwest where the J280 to K230 time-thickness map is thickest. Clastics are also inferred to have been supplied down the carbonate slope. This interpretation is based in part on an amplitude extraction from the J280 marker which appears to show a series of high amplitude interfingering submarine fans sourced from the NW. Salt outlines on this map are highly schematic. Refer to text for details.
On seismic profiles through shelfal areas of the subregional study area, the Missisauga and Logan Canyon formations are characterized by relatively flat-lying continuous, moderate to high amplitude seismic reflections (e.g. Figures 15 and 16). The reflections correspond to mixed sandstone and shale topsets, locally truncated by erosional channels or the heads of canyons that extended back onto the shelf. The O-marker oolitic limestone member also produces a high amplitude seismic reflection within the topsets, and defines the boundary between the Lower and Upper divisions of the Missisauga Formation (as defined by Jansa and Wade, 1975). Topsets, including the O-marker, pass seaward into discontinuous, generally low amplitude seismic reflections corresponding to mud-prone prodelta clinoforms of the Verrill Canyon Formation (Wade and MacLean, 1990). The approximate maximum progradation limit of shelf depositional systems presented in Figures 10-13 is based on a combination of well data and recognition of seismically-defined clinoforms, where present. In the Upper Missisauga to Logan Canyon interval in particular, upper slope clinoforms are commonly offset by numerous listric growth faults that make identification of the paleo-shelf edge, and correlation of shelf stratigraphy into deepwater, challenging (Figure 15).
Lower Missisauga Formation
Below the O-marker, a well-developed paleo shelf-edge is preserved in the NE corner of the subregional study area that marks the maximum regression of the Lower Missisauga Formation (Figure 12). Lower Missisauga topsets and equivalent clinoforms prograded southward and, to some extent, sediment dispersal was constrained by the limited amount of accommodation that developed above the slowly subsiding Jurassic bank edge to the west, and a prominent salt cored Jurassic high to the east (near the Alma field; see Figures 11 and 12). Above the Abenaki bank edge, wells like Queensland M-88 and Demascota G-32 show a well-developed upward coarsening package that passes up-section from Valanginian shale (Verrill Canyon Formation) to coarser grained Hauterivian sandstone (Lower Missisauga Formation). In Demascota G-32, the upper 150 m interval of Lower Missisauga strata has a net:gross of > 40%, composed of stacked, generally < 10 m thick, sands (Figure 17).
FIGURE: 12
Schematic paleogeography map for sand-prone Missisauga and lowermost Logan Canyon Formations and equivalent strata. Local preservation of offlap breaks (i.e. the transition from topsets to foresets) indicates these sandy systems built progressively toward the south. Recognition of canyons west of Alma implies that clastics associated with these delta systems were also transported into deepwater, an idea confirmed by Newburn H-23 which penetrated several thin intervals of sandstone to pebble conglomerates. A time-thickness map for the K230 to K140 interval suggests the primary sediment source for Parcels 1 and 2 was from the westernmost Sable Subbasin. This interval is interpreted to have reservoir potential, with the thickest sediment accumulations taking place in a complex network of minibasins believed to occupy a mid to lower slope position. Refer to text for details.
Schematic paleogeography map for sand-prone Missisauga and lowermost Logan Canyon Formations and equivalent strata. Local preservation of offlap breaks (i.e. the transition from topsets to foresets) indicates these sandy systems built progressively toward the south. Recognition of canyons west of Alma implies that clastics associated with these delta systems were also transported into deepwater, an idea confirmed by Newburn H-23 which penetrated several thin intervals of sandstone to pebble conglomerates. A time-thickness map for the K230 to K140 interval suggests the primary sediment source for Parcels 1 and 2 was from the westernmost Sable Subbasin. This interval is interpreted to have reservoir potential, with the thickest sediment accumulations taking place in a complex network of minibasins believed to occupy a mid to lower slope position. Refer to text for details.
In more rapidly subsiding areas between the Abenaki bank edge and the salt-cored structural high at Alma (and landward of Alma), progradation of Berriasian to Hauterivian topsets and clinoforms outpaced the creation of salt withdrawal accommodation, and hence the offlap break advanced seaward (building toward the south) (Figures 15 and 16). Although there are no wells that test the expanded Lower Missisauga section directly east of Demascota G-32, the Cree I-34 well penetrated a similar seismic succession 20 km to the east (and 15 km landward of Alma F-67). It encountered a >1000 m thick expanded Lower Missisauga section containing abundant sandstone. The upper 500 m of Valanginian to Hauterivian strata have a net:gross of > 55%. These strata are probably time-equivalent to the upward-coarsening trend observed at Demascota G-32. Cree I-34 also encountered an older (Berriasian to Valanginian) high net:gross interval consisting of five 70 to 120 m thick upward-coarsening regressive shale to sandstone cycles that mark the periodic advance and retreat of rivers crossing this part of the shelf. In some cases very coarse sandstone to conglomerate were penetrated near the tops of these cycles (ExxonMobil et al., 2004). The Lower Missisauga interval penetrated at Cree I-34 is probably somewhat representative of what would be penetrated 5-10 km east of Demascota G-32, an area interpreted to be a primary source of clastics supplied to Parcels 1 and 2.
The maximum seaward extent of the Lower Missisauga shelf-edge (just below the O-marker) is shown in Figure 12. Maximum regression stopped about 1 km short of the Alma field, and Alma F-67 penetrated the mud-prone clinoforms just seaward of the offlap break (corresponding to the Verrill Canyon Formation). Predictably, Alma F-67 did not encounter any Lower Missisauga sands (Figure 17).
FIGURE: 13
Schematic paleogeography map for the Logan Canyon Formation and equivalent deepwater strata. In the westernmost Sable Subbasin, sedimentation took place primarily above listric growth faults, where more than 2.5 km of shale dominated strata were encountered by Evangeline H-98. For the first time, shelf clastic systems also prograded beyond the edge of the Jurassic shelf NW of Parcels 1 and 2, renewing sediment input into deepwater from this direction. Recognition of several broad slope canyons is consistent with sediment input from both the Sable Subbasin region and from across the NW Abenaki margin. Thin-skinned extension associated with increased sedimentation on the upper slope near Evangeline was balanced down-slope by contraction. The "Newburn fold-and-thrust belt" developed as a consequence, and folding of existing structures in Parcels 1 and 2 was rejuvenated.
Schematic paleogeography map for the Logan Canyon Formation and equivalent deepwater strata. In the westernmost Sable Subbasin, sedimentation took place primarily above listric growth faults, where more than 2.5 km of shale dominated strata were encountered by Evangeline H-98. For the first time, shelf clastic systems also prograded beyond the edge of the Jurassic shelf NW of Parcels 1 and 2, renewing sediment input into deepwater from this direction. Recognition of several broad slope canyons is consistent with sediment input from both the Sable Subbasin region and from across the NW Abenaki margin. Thin-skinned extension associated with increased sedimentation on the upper slope near Evangeline was balanced down-slope by contraction. The "Newburn fold-and-thrust belt" developed as a consequence, and folding of existing structures in Parcels 1 and 2 was rejuvenated.
Upper Missisauga Formation
The oolitic O-marker was probably deposited during a period of relative sea level rise (Wade and MacLean, 1990) that caused a temporary halt to the seaward advance of Lower Missisauga deltas. On seismic profiles, the O-marker defines a break in the progradational character of the outer shelf that is consistent with a period of increased shelf accommodation, followed by a period of continued progradation as the sand-prone Upper Missisauga Formation advanced across it (Figure 15 and 16). Above the O-marker, the transition from flat-lying moderate amplitude topsets to inclined lower amplitude foresets defines a shelf-edge that can be recognized locally between the Abenaki carbonate bank edge and Alma (Figure 16). This Upper Missisauga shelf-edge advanced abruptly seaward, extending the shelf more than 10 km south of its Lower Missisauga position (see also figure 15 of Cummings and Arnott, 2005, and figure 10 of Cummings et al., 2006). Mapping the shelf-edge trajectory, however, is increasingly complicated to the east of the stable Jurassic bank due to the increased frequency of growth faults (hence the shelf-edge in Figure 12 should be considered approximate).
In contrast to the Lower Missisauga Formation, the salt-cored high near Alma does not appear to have influenced Upper Missisauga sediment dispersal. At Demascota G-32 and Musquodoboit E-23, the upper Missisauga Formation shows an abrupt upward-coarsening trend grading from an interval of interbedded shale, limestone, and sandstone (above the O-marker), to a >120 m thick interval dominated by medium to coarse-grained sandstone with a net:gross >70%. These wells penetrate the seismically defined topsets of a progradational margin (Figure 17), and are comprised variably of braided fluvial to coastal plain deposits (Cummings et al., 2006, see their figure 7b). A similar Barremian to Early Aptian Upper Missisauga package was penetrated at Alma K-85 and F-67, comprised of 10 to 200 m thick stacked, upward coarsening units interpreted as regressive delta-front sands advancing over prodelta muds (Cummings et al., 2005). The distal Upper Missisauga Formation at Alma K-85 still has a net:gross of >40%.
Further west, a 60 m upward coarsening Barremian sandstone interval at Oneida O-25 records the approximate position of the shelf-edge NW of Parcels 1 and 2 (Figure 12). There appears to have been insufficient sediment supply coming from the NW to advance the Missisauga Formation to the edge of the underlying Jurassic bank at this time (Wade and MacLean, 1990). Hence, the Missisauga delta in this area was perched above the stable shelf, and most of the Missisauga-equivalent clastics supplied to Parcels 1 and 2 instead are interpreted to have come from the Sable Subbasin to the NE where the sediment supply was greater and focused along an advancing shelf-edge.
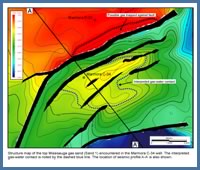
FIGURE: 14
Litho-chronostratigraphic chart adapted from Wade et al. (1993, 1995). On the right the chart shows the interpreted age correspondence of deepwater seismic markers mapped by Shell (NS24-S06-01E/02E) and by the CNSOPB. Age designations are based primarily on ties to Newburn H-23. Note that the age assignments of the J265 and J280 markers are speculative.
Litho-chronostratigraphic chart adapted from Wade et al. (1993, 1995). On the right the chart shows the interpreted age correspondence of deepwater seismic markers mapped by Shell (NS24-S06-01E/02E) and by the CNSOPB. Age designations are based primarily on ties to Newburn H-23. Note that the age assignments of the J265 and J280 markers are speculative.
Logan Canyon Formation
Coarse clastics of the Upper Missisauga Formation were blanketed by a 190 m (e.g. Demascota G-32) to 450 m (e.g. Merigomish C-52) thick Aptian shale-dominated unit corresponding to the widespread Naskapi Member of the Logan Canyon Formation (Figure 17). This shaly unit was probably deposited during a major transgression that drowned the Upper Missisauga delta platform (Wade and MacLean, 1990). The transgression was followed by a period of upbuilding and outbuilding that prograded a mix of sand and mud across the shelf, corresponding to the Cree Member of the Logan Canyon Formation (Wade and MacLean, 1990). The Cree Member passes up-section into the Sable Member, a second transgressive shale unit, which in turn transitions into the sandier Marmora Member.
On the stable outer shelf NW of Parcels 1 and 2 (above the Abenaki bank), seismic facies equivalent to the lower part of the Cree Member have an aggradational-progradational character, passing from topsets to foresets that built out towards the bank edge (above and seaward of the underlying Missisauga Formation). Oneida O-25 penetrated the topsets of this package and encountered a ~120 m thick lower Cree regressive sand-prone unit above the Naskapi shale. Progradation of the lower Cree offlap break in the Oneida area stopped about 10-13 km short of the underlying Abenaki bank edge. Like the underlying Upper Missisauga Formation, only the seaward thinning prodelta clinoforms of the lower Cree Member reached the bank edge, hence inhibiting sand transport into deep water from this direction (Figure 12).
In contrast, equivalent lower Cree strata to the east prograded to, and beyond, the Jurassic bank edge. The seismic profile in figure 10 of Cummings et al. (2006) shows the prominent progradational character and well-developed topset to foreset transition above the outer part of the Jurassic bank. Limited faulting above the Jurassic bank allowed the preservation of these stratal geometries. Offlap breaks are also locally preserved on seismic profiles in front of the Jurassic bank edge through the southern part of the Huckleberry 3D seismic survey (e.g. south of Demascota G-32, where the bank edge turns sharply to the north). These offlap breaks are shown in profile B-B' (Figure 16, which passes through the Huckleberry 3D survey), but the preponderance of growth faults seaward and to the east prevents following them more than a few kilometers. In the area near Cree and Alma, the lower part of the Cree Member consists of two or three 30 to 75 m thick upward-coarsening sandstone units of Aptian age that abruptly prograded across shelf mudstones of the Naskapi Member. They are composed of medium to coarse-grained sandstone that can be correlated as far south as Merigomish C-82 (Figure 17), providing some constraints on the location of the shelf-edge in this heavily faulted area (Figure 12).
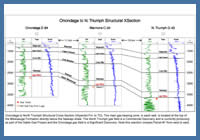
FIGURE: 15
Regional seismic line A - A'. The line is arranged roughly NNE (right) to SSW (left) and crosses the Missisauga and Logan Canyon formations and their seaward equivalents. West of Alma, Missisauga equivalent strata are characterized by a series of topsets to foresets that record the southward advance of delta systems adjacent to the Abenaki carbonate bank. These strata believed to pass seaward into a series of submarine fans deposited above local steps on the middle to lower slope in the areas of Parcels 1 and 2. See Figures 10-13 for location and text for details.
Regional seismic line A - A'. The line is arranged roughly NNE (right) to SSW (left) and crosses the Missisauga and Logan Canyon formations and their seaward equivalents. West of Alma, Missisauga equivalent strata are characterized by a series of topsets to foresets that record the southward advance of delta systems adjacent to the Abenaki carbonate bank. These strata believed to pass seaward into a series of submarine fans deposited above local steps on the middle to lower slope in the areas of Parcels 1 and 2. See Figures 10-13 for location and text for details.
The remaining Albian to Cenomanian Logan Canyon Formation is highly aggradational. On the stable outer shelf NW of Parcels 1 and 2 (above the Abenaki bank), it forms a seaward thickening mud-dominated wedge that is thickest at or seaward of the Jurassic bank edge (Figure 13). At Oneida O-25, more than 600 m of shale-dominated strata were penetrated in the flat-lying 'topsets' above the lower Cree equivalent section. West of Evangeline H-98, these strata thicken to > 1100 ms (two-way time), near the edge of the Jurassic bank, with a pronounced further increase to more than 1600 ms (two-way time) across the bank edge. Growth was accommodated along listric faults that appear to detach above the steep Jurassic slope, ultimately detaching above autochthonous salt. At Evangeline H-98, the mid-Albian to Cenomanian interval is more than 2.5 km thick (Williams, 1991), and composed almost entirely of shale. This predominantly shaly section could have been supplied by a mud-dominated system that advanced toward the SE across the outer Jurassic bank. Alternately, shaly strata could also have been derived from muddy prodelta plumes transported along slope from sandier Logan Canyon depositional systems to the NE. The upper part of the Logan Canyon Formation generally becomes sandier to the north and east of Evangeline, and Alma F-67 and Wenonah J-75 each encountered several 5-15 m thick upward coarsening sandstone intervals separated by 10-60 m thick shale intervals.
Breaching the shelf-edge and the transport of Lower Cretaceous sands into deepwater
Potential Berriasian to Aptian reservoir intervals in Parcels 1 and 2 were probably derived primarily from sand-prone deltas of the Missisauga Formation and lowermost Logan Canyon Formation. Evidence for the transfer of Lower Cretaceous sediment into deepwater was presented by Piper et al. (2004) who documented Early Cretaceous soft-sediment deformation in cores from the Alma K-85, Alma F-67, and Merigomish C-52 (from the Upper Missisauga Formation to the Cree Member of the Logan Canyon Formation). They recognized a wide range of sedimentary features indicative of mass failure on the outer shelf and upper slope, including large slide blocks, debris flow deposits, and turbidite sandstone beds deposited on the prodelta. They also described a number of mechanisms capable of efficiently transporting sandy Lower Cretaceous sediment from the shelf-edge into deepwater, including: a) direct input from rivers in flood, when fluvial channels debauched near the shelf-edge (hyperpycnal flows during lowstands in sea level), b) earthquake-induced failure of thick outer shelf sands, and c) storm resuspension of outer shelf sands.
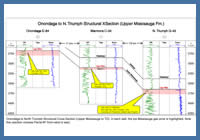
FIGURE: 16
Seismic line B - B' crossing the south-prograding topsets and foresets of the Lower to Upper Missisauga Formation and lower Logan Canyon Formation. These deltaic systems are interpreted to be the primary source for coarse clastics supplied via canyons into Parcels 1 and 2. See Figures 10-13 for location.
Seismic line B - B' crossing the south-prograding topsets and foresets of the Lower to Upper Missisauga Formation and lower Logan Canyon Formation. These deltaic systems are interpreted to be the primary source for coarse clastics supplied via canyons into Parcels 1 and 2. See Figures 10-13 for location.
In addition to the evidence presented by Piper et al. (2004), there is strong evidence on seismic profiles for periods of canyon incision (Figures 18 and 19). Seismic facies below and seaward of the advancing Lower Missisauga, Upper Missisauga, and lowermost Logan Canyon formations are complex and commonly contain variable amplitude U-shaped erosional features on strike profiles (e.g. Figure 19). These are interpreted as canyons or failure scars associated with the initiation and down slope transport of sediment gravity flows. On vertical seismic profiles, most canyon incisions are defined by subtle surfaces of truncation. They are most easily recognized where canyon heads extend back onto the outer shelf and truncate higher amplitude, more continuous seismic reflections of sand-prone delta topsets (and the O-marker). In addition to canyon incisions, a number of very high amplitude U-shaped 'channel-forms' are present within canyons or as isolated features on the prodelta slope. They are interpreted to be sand-prone deposits that accumulate along channel axes (see Deptuck et al., 2007), and are particularly common in Lower Missisauga equivalent strata. In general, correlation of canyons and channels over distances greater than 5-10 km down the slope is not possible due to the lack of impedance contrast in this setting, presence of few continuous seismic reflections, offset along listric faults (particularly south of Alma), and poor seismic imaging of prodelta strata.
Canyons appear to be clustered at the intersection of the Sable Subbasin and the Abenaki bank, 55 km north of Parcel 2. Three S to SSW oriented canyons erode Upper Missisauga and lower Logan Canyon equivalent strata in Figure 19. From oldest to youngest they are named the Lower, Middle, and Upper Huckleberry canyons. At least 2 additional older canyons are oriented parallel to the Abenaki margin, landward of this profile, and erode Lower Missisauga strata (see Figure 11). Each canyon has a maximum width of about 4 km and a depth up to 250 ms (two-way time). A time-structure map and 3D seismic coherence slice through the Middle Huckleberry Canyon is shown in Figure 18. The canyon extends back onto the topsets of the Lower Missisauga Formation delta and erodes the widespread O-marker and underlying strata. The canyon head is comprised of multiple dendritic branches, and is filled by prograding topsets and clinoforms of Upper Missisauga and lowermost Logan Canyon shelf-edge deltas that advanced toward the south (Figure 18c). Because canyon heads commonly extend back onto the sand-prone delta platform, it is unlikely that only muddy turbidity flows were initiated and transported into deepwater during the Early Cretaceous. Pebble conglomerates (Figure 20) and multiple intervals of sandstone encountered in Newburn H-23 (Chevron et al., 2002) corroborate this interpretation, indicating that during the Early Cretaceous, vigorous sediment gravity flows periodically transported coarse-grained material into the deepwater.
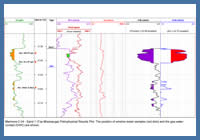
FIGURE: 17
Schematic well correlation panel showing the primary sand-prone intervals in the Missisauga Formation and lowermost Logan Canyon Formation (lower part of the Cree Member), correlated to equivalent strata at Newburn H-23 and a hypothetical well located in the centre of Parcel 2. Note that down-to-the-basin listric growth faults south of Alma F-67 are not shown, nor are the thrusted anticlines seaward of Newburn H-23 (that developed in response to upslope extension). These structures, which can be seen in seismic transect A-A', were particularly active after deposition of the Upper Missisauga Formation. A salt cored Jurassic high formed a positive bathymetric element at Alma F-67 that caused thinning of Berriasian to Hauterivian prodelta shales at this location. This structure, combined with the positive relief of the Abenaki platform, is interpreted to have directed Lower Missisauga delta progradation toward the south. Not shown on this panel is the Cree I-34 well, which encountered an expanded sand-rich Lower Missisauga section that is believed to be more representative of the southward prograding Lower Missisauga section between Alma F-67 (above the salt-cored high) and Demascota G-32 (above the Abenaki bank). See Figures 10-13 for figure location.
Schematic well correlation panel showing the primary sand-prone intervals in the Missisauga Formation and lowermost Logan Canyon Formation (lower part of the Cree Member), correlated to equivalent strata at Newburn H-23 and a hypothetical well located in the centre of Parcel 2. Note that down-to-the-basin listric growth faults south of Alma F-67 are not shown, nor are the thrusted anticlines seaward of Newburn H-23 (that developed in response to upslope extension). These structures, which can be seen in seismic transect A-A', were particularly active after deposition of the Upper Missisauga Formation. A salt cored Jurassic high formed a positive bathymetric element at Alma F-67 that caused thinning of Berriasian to Hauterivian prodelta shales at this location. This structure, combined with the positive relief of the Abenaki platform, is interpreted to have directed Lower Missisauga delta progradation toward the south. Not shown on this panel is the Cree I-34 well, which encountered an expanded sand-rich Lower Missisauga section that is believed to be more representative of the southward prograding Lower Missisauga section between Alma F-67 (above the salt-cored high) and Demascota G-32 (above the Abenaki bank). See Figures 10-13 for figure location.
Deepwater depositional systems in the areas of Parcels 1 and 2
Ten Jurassic and Cretaceous seismic markers were correlated through the Thrumcap 3D seismic survey (NS24-S6-1E/2E) south and west of the main region of delta progradation and canyon erosion described above (Figures 14 and 15). Five of these markers (J350, J280, K230, K140, and K095) were used to generate the time-thickness maps presented in Figures 10, 11, 12, and 13.
Deeper water calibration in the subregional study area, though limited, is provided by Shubenacadie H-100, Evangeline H-98, Newburn H-23, and Weymouth A-45. No age control is available for Weymouth A-45, and Shubenacadie H-100 does not penetrate strata older than Cenomanian (Fensome et al., in press). Similarly, Evangeline H-98 does not penetrate strata older than Aptian (Ascoli, 2006) or Albian (Williams, 1991). Our primary age constraints for pre-Albian strata thus come from a synthetic well tie to Newburn H-23, with age data from Biostratigraphic Associates (2002). Correlation of regional seismic markers into the Newburn H-23 well is complicated by a series of thrust faults seaward of, and adjacent to, the well location. Further difficulties in tying the well to regional picks arise because of the discontinuous character of seismic reflections and poor seismic imaging below thick Cenomanian to Albian overpressured shale. Thus the age designations presented here should be considered approximate, with the degree of confidence indicated by the length of the bars in Figure 14. No direct deepwater age control is available for strata older than Valanginian, so age designations for markers deeper than K230 are inferred based on shelf to slope correlation and other lines of evidence discussed below. We have also attempted to relate the age designation of CNSOPB seismic markers to those of Shell (2002; NS24-S6-1E/2E) (Figure 14).
Sediment dispersal arrows for deepwater strata are based on the thickness distribution of sediments as well as the presence and orientation of submarine canyons and channels. The distribution of salt and syndepositional faults outside the Thrumcap 3D survey area is approximate.
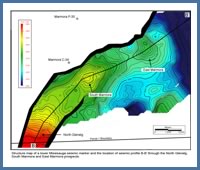
FIGURE: 18
Perspective views of, and a coherence time-slice through, the middle Huckleberry Canyon located west of Alma. See Figures 10-13 for figure location.
Perspective views of, and a coherence time-slice through, the middle Huckleberry Canyon located west of Alma. See Figures 10-13 for figure location.
J350 to J280 - Mohican to lower Mic Mac equivalent strata
The time-thickness map for the J350 to J280 interval is shown in Figure 10. The J350 marker defines the top of autochthonous salt, and where the salt is absent, the J350 surface was mapped along the weld that separates overlying strata from underlying basement or intervals of high amplitude reflections interpreted as synrift clastics. Strata between the J350 and J280 markers correspond to the first units to load and mobilize the autochthonous Argo salt (Figure 10, 15). Though there is no direct age control for this interval in the study area, the first stratigraphic unit to load and mobilize the autochthonous Argo salt on the shelf NW of the study area (north of Acadia K-62) was the Mohican Formation consisting of immature clastics (Wade and MacLean, 1990). Hence, strata above the top autochthonous salt marker (J350) in the Thrumcap 3D seismic area are inferred to be the slope equivalent of the Mohican Formation. Correlation of seismic profiles from Acadia K-62 into Parcel 1, support this interpretation.
The time-thickness map in Figure 10 shows a series of subcircular to elongate minibasins that contain low amplitude seismic reflections that pass up-section into progressively higher amplitude and more continuous reflections near the J280 marker. Strata thin by convergence or onlap onto inflated autochthonous salt or basement highs. Some clastics may have been delivered to these minibasins from the NW where a Mohican-equivalent shelf margin is preserved north and west of the Acadia K-62 well. Here, a rapidly thickening progradational clastic wedge, composed of up to 2000 m of Mohican strata, was deposited above autochthonous salt and below the Abenaki Formation (Wade and MacLean, 1990). The up-section increase in seismic amplitude within minibasins is believed to correspond to an increase in carbonate content of deepwater strata, reflecting increased influence from the Jurassic Abenaki margin that accumulated on the stable platform NW of Parcels 1 and 2 (Figure 10). Sediment transport is inferred to have been normal to the steep foreslope of the Abenaki carbonate bank. This interpretation is based in part on the character of an amplitude extraction from the J280 marker in the Parcel 1 area, which may show a series of interfingering submarine fans sourced from the NW. The boundary between amorphous autochthonous salt and low amplitude fill of overlying minibasins is difficult to identify in the eastern part of Parcel 2. Hence, the distribution of Jurassic minibasins in this area is unknown, and likewise the potential for sediment delivery from the NE is uncertain (from the Sable Subbasin area).
J350 to J280 strata were deformed in a variety of ways reflecting passive loading of autochthonous salt above rapidly subsiding basement (e.g. thin-skinned extension, turtles, salt-cored anticlines). Some structures appear to have been strongly influenced by the evacuation of salt above rifted basement that had an irregular morphology produced by a complex arrangement of horsts and grabens (and half-grabens). In some locations, inverted minibasins formed as salt evacuated and strata were folded around positive-relief basement highs. The presence of salt diapirs adjacent to basement highs may indicate that salt extrusion took place preferentially along basement lineaments during pre-J280 down building. Primary salt welds are common below Jurassic minibasins, and some turtle-like structures are present. Autochthonous salt is locally preserved below the J350 marker as salt pillows or anticlines, and remnant salt thicks form subcircular rims around some minibasins.
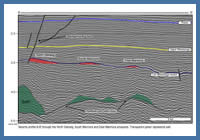
FIGURE: 19
Seismic line C - C' crossing roughly normal to the direction of progradation of the Lower and Upper Missisauga Formations, and lowermost Logan Canyon Formation. Several erosional features are recognized above the topsets. The most prominent are associated with the Huckleberry canyon system located near the intersection of the Abenaki carbonate bank and southward prograding Lower Cretaceous delta systems. These canyons are interpreted to form the conduits for clastics funneled into deepwater in the areas of Parcels 1 and 2. See Figures 10-13 for figure location, and Figure 18 for a perspective view of the middle Huckleberry Canyon.
Seismic line C - C' crossing roughly normal to the direction of progradation of the Lower and Upper Missisauga Formations, and lowermost Logan Canyon Formation. Several erosional features are recognized above the topsets. The most prominent are associated with the Huckleberry canyon system located near the intersection of the Abenaki carbonate bank and southward prograding Lower Cretaceous delta systems. These canyons are interpreted to form the conduits for clastics funneled into deepwater in the areas of Parcels 1 and 2. See Figures 10-13 for figure location, and Figure 18 for a perspective view of the middle Huckleberry Canyon.
The most proximal minibasins located along the steep Abenaki slope are flanked by low angle listric faults believed to have formed in response to tilting of the margin after continental break-up and the onset of rapid thermal subsidence. Thin-skinned extension normal to the Abenaki slope is interpreted to have been driven by gravity gliding, with sediment detaching above autochthonous salt. Extension was balanced down-slope by contraction that lead to the development of early NE to SW oriented folds in the areas of Parcels 1 and 2. Some degree of thick-skinned extension in response to continued motion between rifted basement blocks may also have influenced early fold development (Deptuck et al., in prep).
J280 to K230 - upper Mic Mac to lower Missisauga equivalent strata
A time-thickness map for the J280 to K230 interval is shown in Figure 11. There is no direct age control for most of this interval, but for reasons described below we infer that strata between the J280 and K230 markers were deposited in the latest Jurassic to Valanginian. The presence of subcircular to elongate minibasins in the west suggests that sediment continued to be supplied down the Abenaki slope at this time. The general increase in minibasin thickness to the east, however, implies there was also a sediment source from the western Sable Subbasin area. The interval between the J280 and K230 markers can be subdivided into two units: a lower moderate to high amplitude interval between J280 and J265, and an upper low amplitude interval between J265 and K230 (Figure 15).
At the base of the lower interval, the J280 marker forms a prominent seismic reflection that was mapped widely across the study area. It corresponds to Shell's (2002) J210 marker, which they placed near the top of the Abenaki equivalent section. Our preferred age designation for J280, however, is somewhere in the middle Abenaki (top Scatarie or Misaine), which is consistent with Shimeld's (2004) J2/MJ marker (tied to his figure 7b). This age designation is reasonable because the J280 marker is overlain (and to some extent underlain) by a series of moderate to high amplitude shingled seismic reflections believed to correspond to calciclastic submarine fans shed from the Abenaki margin (or intervals of siliciclastic submarine fans interbedded with foreslope carbonates). If correct, the J265 marker (2-3 seismic cycles above J280) may more closely correspond to the termination of carbonate bank deposition on the shelf NW of Parcels 1 and 2. Reflections below J265 commonly onlap or downlap the J280 marker, particularly in Parcel 1.
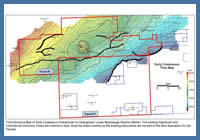
FIGURE: 20
Photos of sidewall cores from the Newburn H-23 well history report (Chevron et al., 2002).
Photos of sidewall cores from the Newburn H-23 well history report (Chevron et al., 2002).
The interval above J265 consists of distinctively low amplitude reflections that show significant growth and down building into minibasins as autochthonous salt continued to be expelled into isolated diapirs (Figure 15). The interval onlaps the steep Jurassic slope, with strata significantly thinning above the crests of early folds in Parcels 1 and 2. The rapid thickness variations of deepwater strata imply active deposition strongly influenced by bathymetric highs and gradient changes along the sediment transport path. The K230 marker above this interval corresponds to Shell's (2002) C5 marker. Our age designation for K230 is in agreement with Shell (2002), and is corroborated by a synthetic tie to Newburn H-23, which indicates the marker corresponds roughly to lowermost Hauterivian or Valanginian strata (Biostratigraphic Associates, 2002; Kidston et al., 2007). Hence, the K230 marker corresponds to strata equivalent to the middle part of the Lower Missisauga Formation on the shelf. Identification of roughly time-equivalent canyons on the shelf (Figure 11) could mean that despite its low amplitude character, some sandstone could be present in this interval. This, however, would require sandstone below K230 to be acoustically transparent in Parcels 1 and 2. It is also possible that the J265 to K230 minibasins were filled with shale-dominated strata.
K230 to K140 - Missisauga to lowermost Logan Canyon equivalent strata
A time-thickness map for the K230 to K140 interval is shown in Figure 12. This interval marks a pronounced increase in the amplitude of seismic reflections compared to underlying strata (Figure 15), and is interpreted to have reservoir potential. Sediment thickness decreases to the SW, with the thickest accumulations taking place in a complex network of minibasins believed to occupy a mid to lower slope position. In general the K230 to K140 interval shows less pronounced thinning above early folds than the underlying interval, probably because folds were overwhelmed by the influx of clastics. Sediment dispersal at this time appears to have been predominantly from the western Sable Subbasin area, NE of Parcels 1 and 2. Based on a well tie to Newburn H-23, we infer that strata between the K230 and K140 markers were deposited in the Valanginian to early Albian, and hence they are equivalent to the Lower Missisauga to lowermost Logan Canyon formations on the shelf.
The lower part of the interval, between the K230 and K195 markers (Figure 14), contains a particularly well developed succession of moderate to high amplitude seismic reflections. On first inspection, reflections appear continuous, but correlation of individual seismic loops indicates they commonly thin laterally and interfinger with adjacent slightly younger or older reflections. Baselap between reflections is common but very subtle. Amplitude extractions vary widely from one seismic loop to the next, showing lateral shifts in broad to elongated areas of maximum amplitude. Linear to curvi-linear SW-oriented amplitude anomalies, interpreted as submarine channels, are common. On vertical seismic profiles, channels locally truncate more continuous sheet-like seismic reflections. This seismic facies assemblage is interpreted to correspond to sand-prone compensationally stacked submarine fans composed of turbidite sheets or channeled-sheets. If correct, the lateral change in seismic facies of individual seismic loops may reflect the lateral thinning of sands and passage into shaly strata, as documented in high-resolution studies from modern fan systems off East Corsica (see Deptuck et al., 2008).
NE of Parcels 1 and 2, near Newburn H-23, seismic facies are more complex, due in part to a series of thrust faults that offset the interval and poor seismic imaging below a thick succession of overpressured shale. In general, seismic reflections are more discontinuous (compared to equivalent strata in Parcels 1 and 2) and may reflect an increased occurrence of poorly imaged channels or canyons within slope strata. Newburn H-23 encountered three ~ 6 m thick turbidite sandstones within a K230 to K195 interval dominated by gray calcareous shale (Chevron et al., 2002). Two of these sandstones were gas bearing (sands 3 and 4 of Kidston et al., 2007). Sidewall cores sampled fine to very fine grained felsic to quartz-rich turbidite sandstone ranging from massive to ripple cross laminated (Figure 20). Sand 3 (5402-5408 m MD) and sand 4 (5958-5964 m MD) have average porosities of 19% and 14%, respectively, and sidewall core permeability measurements range from < 0.1 mD to 6.4 mD (Kidston et al., 2007). Sidewall cores from the silty to shaly section above sand 3 encountered several sharp-based mm- to cm-scale beds that are consistent with fine-grained turbidites sampled in channel overbanks settings (levees) on the Amazon Fan (Piper and Deptuck, 1997). Similar thin-bedded very fine grained sand to mud turbidites were encountered in 12 of the 14 sidewall cores recovered between sand 2 and sand 3, suggesting that Hauterivian to Barremian strata were dominated by deposits from fine-grained turbidity currents that overspilled from adjacent submarine channels (i.e. Newburn H-23 encountered the overbank muds but not the channel-axis sands).
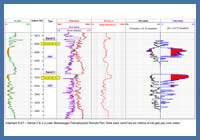
FIGURE: 21
Amplitude extraction from the K140 marker showing an Aptian(?) submarine channel system (on the eastern flank of the Big Thrum prospect - Parcel 2) and corresponding submarine fan deposited above a local step on the middle to lower slope (northern part of the Crows Neck prospect - Parcel 1). A representative seismic profile across the eastern flank of the 'Big Thrum' prospect (line X-X') shows the development of submarine channels at several stratigraphic levels in Lower Cretaceous strata.
Amplitude extraction from the K140 marker showing an Aptian(?) submarine channel system (on the eastern flank of the Big Thrum prospect - Parcel 2) and corresponding submarine fan deposited above a local step on the middle to lower slope (northern part of the Crows Neck prospect - Parcel 1). A representative seismic profile across the eastern flank of the 'Big Thrum' prospect (line X-X') shows the development of submarine channels at several stratigraphic levels in Lower Cretaceous strata.
The shallower K195 to K140 interval in Parcels 1 and 2 is also interpreted to have reservoir potential. Increased erosion between some salt diapirs (where sediment gravity flows were laterally constrained and hence more erosive), combined with evidence for submarine channels, suggests an active sediment transport corridor existed through the parcels. Thickness maps indicate the slope was stepped, creating local areas of increased sediment accumulation and providing a trapping mechanism for coarser clastics supplied from the western Sable Subbasin. An amplitude extraction from the K140 marker shows a particularly well developed south-oriented submarine channel system in Parcel 2 that feeds a 'slope-break' submarine fan (sheet or channeled sheet) in Parcel 1, deposited where the gradients locally decreased (Figure 21). Upslope, Newburn H-23 encountered two sandstone to conglomerate intervals. The shallowest (4306-4326 m) is about 20 m thick, with the bottom 8 m of section producing a blocky gamma ray response and the upper 12 m producing a more serrated upward fining gamma ray response. Two sidewall cores from the lower blocky interval (4323 and 4317 m) are conglomeratic, consisting of a poorly sorted sandstone matrix containing rounded to subrounded polymictic pebbles (Figure 20). These are interpreted as lag deposits from a submarine channel that transported sands further into the basin. Average porosity is 18% (Kidston et al., 2007). The underlying sandstone (sand 2) is about 9 m thick and is gas bearing. It consists of very fine to fine grained sandstone with an average porosity of 13.5 % (Kidston et al., 2007).
The K195 marker corresponds to the C10 marker of Shell (2002). Our age designation is consistent with Shell, and is corroborated by the synthetic tie to Newburn H-23, where the K195 marker correlates to Barremian strata (Biostratigraphic Associates, 2002). Hence the K195 marker is time equivalent to the O-marker on the shelf, or somewhere within the Upper Missisauga Formation. The K140 marker corresponds to Shell's (2002) mid-Aptian C30 marker. Our age designation for K140 is somewhat younger, however, with well ties at both Newburn H-23 (Biostratigraphic Associates, 2002) and Evangeline H-98 (Williams, 1991) indicating it has a lower or middle Albian age. The K230 to K195 interval was thus deposited while the multiple Valanginian to Barremian regressive sands at Cree I-34 and in other shelf wells were deposited (Figure 17). The K195 to K140 interval in turn was deposited while Barremian to early Albian sands of the Upper Missisauga Formation to lower Cree Member prograded seaward (Figure 12). Canyons incised into the outer shelf and upper slope at this time are interpreted to have acted as conduits for the transport of coarse clastics toward Parcels 1 and 2 (Figures 18 and 19), with Newburn H-23 located in a predominantly bypass location on the upper to middle slope.
K140 to K095 - Logan Canyon equivalent strata
A time-thickness map for the K140 to K095 interval is shown in Figure 13. The apparent westward shift of sediment accumulation coincides with an abrupt change in the style of depositional systems above the K140 marker. Broad scour-like canyons, indicative of sediment bypass, are widely recognized, and are flanked by broad, mud-prone wedge-shaped levees. Their orientations indicate sediment input both from the western Sable Subbasin region and near-normal to the steep Abenaki margin. Erosion is enhanced where flows were constrained between bathymetric highs created by salt diapirs. Seismic reflections are generally low amplitude, except along the broad, smooth canyon floors.
The K095 marker corresponds to a widespread unconformity that is underlain by lower Cenomanian strata at Newburn H-23 (Biostratigraphic Associates, 2002) and Turonian or Cenomanian strata at Shubenacadie H-100 (Fensome et al., in press). The K140 to K095 interval therefore corresponds to Albian through Cenomanian (and perhaps Turonian) strata. On the stable shelf NW of Parcels 1 and 2, equivalent Logan Canyon Formation strata prograded beyond the edge of the Abenaki bank for the first time, helping to explain the increase in slope erosion in this area at this time. On seismic profiles near Oneida O-25, multiple seismically-defined channels or incised valleys are recognized in the Logan Canyon interval on the shelf. There is probably some association between these features and the linear scour-like canyons observed above the K140 marker on the slope.
Strata equivalent to the K140 to K095 interval also form a prominent upper slope growth section above and landward of Evangeline H-98. Mid-Albian to Cenomanian sediment loading on the upper slope (Figure 13) appears to have accelerated thin-skinned extension along existing listric growth faults. In response, strata down-slope underwent pronounced contraction to form the "Newburn fold-and-thrust belt" (Deptuck et al., in prep) (Figures 13 and 15). The fold-belt consists of a series of seaward-vergent thrusts that developed directly down-slope from the region of maximum extension. Similarly, some of the pre-existing salt diapirs and folds in Parcels 1 and 2 were further contracted and the fill of some canyons was inverted. Some of this contraction closed salt stocks and resulted in the overthrusting of strata. East of Parcel 2, upslope extension was balanced by widespread extrusion of salt at the seafloor as seaward-leaning salt stocks were squeezed (a process that began in the earliest Cretaceous).
The upper half of the K140 to K095 interval in Parcel 2 (in particular), shows a distinct increase in chaotic seismic reflections. These are interpreted as mass transport deposits that were shed during this period of contraction. The prominent unconformity above the Newburn fold-and-thrust belt, with truncation of seismic reflections below the K095 marker, probably formed from failures initiated by oversteepening of the slope during contraction (Figure 15).
Figure Captions:
Figure 10. Schematic paleogeography map for the Jurassic, showing the Abenaki carbonate platform along the edge of the stable continental margin. Three main facies zones are shown, corresponding to an inner low energy shelf, an outer high energy shelf, and the steep foreslope that extends into deepwater (see Kidston et al., 2005 for further details). Coeval with the development of the carbonate bank was the deposition of the Upper Jurassic Mic Mac Formation and its equivalents, consisting of a mix of clastics and carbonates that are thickest in the NE corner of the figure. Significant growth faulting and salt mobilization took place while the Mic Mac Formation was deposited. In the areas of Parcels 1 and 2, a time-thickness map for the J350 and J280 markers shows the distribution of the earliest minibasins above autochthonous salt. The minibasins are assumed to contain Jurassic strata composed of the deepwater equivalents of the Mic Mac Formation, as well as strata equivalent to the Mohican Formation. Sediment input into deepwater is presumed to be normal or sub-normal to the steep Abenaki slope. Salt outlines on this map are highly schematic. See text for details.
Figure 11. Schematic paleogeography map for the lowermost Cretaceous. The map shows the southward progradation of the sand-prone Lower Missisauga Formation along the Jurassic carbonate bank. Several canyons are present near the outer shelf, and these are presumed to have supplied clastics to the south and southwest where the J280 to K230 time-thickness map is thickest. Clastics are also inferred to have been supplied down the carbonate slope. This interpretation is based in part on an amplitude extraction from the J280 marker which appears to show a series of high amplitude interfingering submarine fans sourced from the NW. Salt outlines on this map are highly schematic. Refer to text for details.
Figure 12. Schematic paleogeography map for sand-prone Missisauga and lowermost Logan Canyon Formations and equivalent strata. Local preservation of offlap breaks (i.e. the transition from topsets to foresets) indicates these sandy systems built progressively toward the south. Recognition of canyons west of Alma implies that clastics associated with these delta systems were also transported into deepwater, an idea confirmed by Newburn H-23 which penetrated several thin intervals of sandstone to pebble conglomerates. A time-thickness map for the K230 to K140 interval suggests the primary sediment source for Parcels 1 and 2 was from the westernmost Sable Subbasin. This interval is interpreted to have reservoir potential, with the thickest sediment accumulations taking place in a complex network of minibasins believed to occupy a mid to lower slope position. Refer to text for details.
Figure 13. Schematic paleogeography map for the Logan Canyon Formation and equivalent deepwater strata. In the westernmost Sable Subbasin, sedimentation took place primarily above listric growth faults, where more than 2.5 km of shale dominated strata were encountered by Evangeline H-98. For the first time, shelf clastic systems also prograded beyond the edge of the Jurassic shelf NW of Parcels 1 and 2, renewing sediment input into deepwater from this direction. Recognition of several broad slope canyons is consistent with sediment input from both the Sable Subbasin region and from across the NW Abenaki margin. Thin-skinned extension associated with increased sedimentation on the upper slope near Evangeline was balanced down-slope by contraction. The “Newburn fold-and-thrust belt” developed as a consequence, and folding of existing structures in Parcels 1 and 2 was rejuvenated.
Figure 14. Litho-chronostratigraphic chart adapted from Wade et al. (1993, 1995). On the right the chart shows the interpreted age correspondence of deepwater seismic markers mapped by Shell (NS24-S06-01E/02E) and by the CNSOPB. Age designations are based primarily on ties to Newburn H-23. Note that the age assignments of the J265 and J280 markers are speculative.
Figure 15. Regional seismic line A – A'. The line is arranged roughly NNE (right) to SSW (left) and crosses the Missisauga and Logan Canyon formations and their seaward equivalents. West of Alma, Missisauga equivalent strata are characterized by a series of topsets to foresets that record the southward advance of delta systems adjacent to the Abenaki carbonate bank. These strata believed to pass seaward into a series of submarine fans deposited above local steps on the middle to lower slope in the areas of Parcels 1 and 2. See Figures 10-13 for location and text for details.
Figure 16. Seismic line B – B' crossing the south-prograding topsets and foresets of the Lower to Upper Missisauga Formation and lower Logan Canyon Formation. These deltaic systems are interpreted to be the primary source for coarse clastics supplied via canyons into Parcels 1 and 2. See Figures 10-13 for location.
Figure 17. Schematic well correlation panel showing the primary sand-prone intervals in the Missisauga Formation and lowermost Logan Canyon Formation (lower part of the Cree Member), correlated to equivalent strata at Newburn H-23 and a hypothetical well located in the centre of Parcel 2. Note that down-to-the-basin listric growth faults south of Alma F-67 are not shown, nor are the thrusted anticlines seaward of Newburn H-23 (that developed in response to upslope extension). These structures, which can be seen in seismic transect A-A', were particularly active after deposition of the Upper Missisauga Formation. A salt cored Jurassic high formed a positive bathymetric element at Alma F-67 that caused thinning of Berriasian to Hauterivian prodelta shales at this location. This structure, combined with the positive relief of the Abenaki platform, is interpreted to have directed Lower Missisauga delta progradation toward the south. Not shown on this panel is the Cree I-34 well, which encountered an expanded sand-rich Lower Missisauga section that is believed to be more representative of the southward prograding Lower Missisauga section between Alma F-67 (above the salt-cored high) and Demascota G-32 (above the Abenaki bank). See Figures 10-13 for figure location.
Figure 18. Perspective views of, and a coherence time-slice through, the middle Huckleberry Canyon located west of Alma. See Figures 10-13 for figure location.
Figure 19. Seismic line C – C' crossing roughly normal to the direction of progradation of the Lower and Upper Missisauga Formations, and lowermost Logan Canyon Formation. Several erosional features are recognized above the topsets. The most prominent are associated with the Huckleberry canyon system located near the intersection of the Abenaki carbonate bank and southward prograding Lower Cretaceous delta systems. These canyons are interpreted to form the conduits for clastics funneled into deepwater in the areas of Parcels 1 and 2. See Figures 10-13 for figure location, and Figure 18 for a perspective view of the middle Huckleberry Canyon.
Figure 20. Photos of sidewall cores from the Newburn H-23 well history report (Chevron et al., 2002).
Figure 21. Amplitude extraction from the K140 marker showing an Aptian(?) submarine channel system (on the eastern flank of the Big Thrum prospect – Parcel 2) and corresponding submarine fan deposited above a local step on the middle to lower slope (northern part of the Crows Neck prospect – Parcel 1). A representative seismic profile across the eastern flank of the 'Big Thrum' prospect (line X-X') shows the development of submarine channels at several stratigraphic levels in Lower Cretaceous strata.