


Subregional Geology Figures
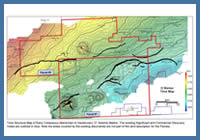
Figure 10
Schematic paleogeography map for the Jurassic, showing the Abenaki carbonate platform along the edge of the stable continental margin. Three main facies zones are shown, corresponding to an inner low energy shelf, an outer high energy shelf, and the steep foreslope that extends into deepwater (see Kidston et al., 2005 for further details). Coeval with the development of the carbonate bank was the deposition of the Upper Jurassic Mic Mac Formation and its equivalents, consisting of a mix of clastics and carbonates that are thickest in the NE corner of the figure. Significant growth faulting and salt mobilization took place while the Mic Mac Formation was deposited. In the areas of Parcels 1 and 2, a time-thickness map for the J350 and J280 markers shows the distribution of the earliest minibasins above autochthonous salt. The minibasins are assumed to contain Jurassic strata composed of the deepwater equivalents of the Mic Mac Formation, as well as strata equivalent to the Mohican Formation. Sediment input into deepwater is presumed to be normal or sub-normal to the steep Abenaki slope. Salt outlines on this map are highly schematic. See text for details.
Schematic paleogeography map for the Jurassic, showing the Abenaki carbonate platform along the edge of the stable continental margin. Three main facies zones are shown, corresponding to an inner low energy shelf, an outer high energy shelf, and the steep foreslope that extends into deepwater (see Kidston et al., 2005 for further details). Coeval with the development of the carbonate bank was the deposition of the Upper Jurassic Mic Mac Formation and its equivalents, consisting of a mix of clastics and carbonates that are thickest in the NE corner of the figure. Significant growth faulting and salt mobilization took place while the Mic Mac Formation was deposited. In the areas of Parcels 1 and 2, a time-thickness map for the J350 and J280 markers shows the distribution of the earliest minibasins above autochthonous salt. The minibasins are assumed to contain Jurassic strata composed of the deepwater equivalents of the Mic Mac Formation, as well as strata equivalent to the Mohican Formation. Sediment input into deepwater is presumed to be normal or sub-normal to the steep Abenaki slope. Salt outlines on this map are highly schematic. See text for details.
Figure 11
Schematic paleogeography map for the lowermost Cretaceous. The map shows the southward progradation of the sand-prone Lower Missisauga Formation along the Jurassic carbonate bank. Several canyons are present near the outer shelf, and these are presumed to have supplied clastics to the south and southwest where the J280 to K230 time-thickness map is thickest. Clastics are also inferred to have been supplied down the carbonate slope. This interpretation is based in part on an amplitude extraction from the J280 marker which appears to show a series of high amplitude interfingering submarine fans sourced from the NW. Salt outlines on this map are highly schematic. Refer to text for details.
Schematic paleogeography map for the lowermost Cretaceous. The map shows the southward progradation of the sand-prone Lower Missisauga Formation along the Jurassic carbonate bank. Several canyons are present near the outer shelf, and these are presumed to have supplied clastics to the south and southwest where the J280 to K230 time-thickness map is thickest. Clastics are also inferred to have been supplied down the carbonate slope. This interpretation is based in part on an amplitude extraction from the J280 marker which appears to show a series of high amplitude interfingering submarine fans sourced from the NW. Salt outlines on this map are highly schematic. Refer to text for details.
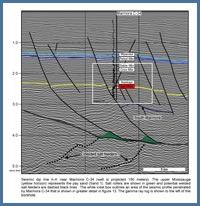
Figure 12
Schematic paleogeography map for sand-prone Missisauga and lowermost Logan Canyon Formations and equivalent strata. Local preservation of offlap breaks (i.e. the transition from topsets to foresets) indicates these sandy systems built progressively toward the south. Recognition of canyons west of Alma implies that clastics associated with these delta systems were also transported into deepwater, an idea confirmed by Newburn H-23 which penetrated several thin intervals of sandstone to pebble conglomerates. A time-thickness map for the K230 to K140 interval suggests the primary sediment source for Parcels 1 and 2 was from the westernmost Sable Subbasin. This interval is interpreted to have reservoir potential, with the thickest sediment accumulations taking place in a complex network of minibasins believed to occupy a mid to lower slope position. Refer to text for details.
Schematic paleogeography map for sand-prone Missisauga and lowermost Logan Canyon Formations and equivalent strata. Local preservation of offlap breaks (i.e. the transition from topsets to foresets) indicates these sandy systems built progressively toward the south. Recognition of canyons west of Alma implies that clastics associated with these delta systems were also transported into deepwater, an idea confirmed by Newburn H-23 which penetrated several thin intervals of sandstone to pebble conglomerates. A time-thickness map for the K230 to K140 interval suggests the primary sediment source for Parcels 1 and 2 was from the westernmost Sable Subbasin. This interval is interpreted to have reservoir potential, with the thickest sediment accumulations taking place in a complex network of minibasins believed to occupy a mid to lower slope position. Refer to text for details.
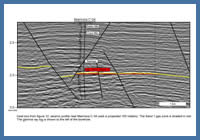
Figure 13
Schematic paleogeography map for the Logan Canyon Formation and equivalent deepwater strata. In the westernmost Sable Subbasin, sedimentation took place primarily above listric growth faults, where more than 2.5 km of shale dominated strata were encountered by Evangeline H-98. For the first time, shelf clastic systems also prograded beyond the edge of the Jurassic shelf NW of Parcels 1 and 2, renewing sediment input into deepwater from this direction. Recognition of several broad slope canyons is consistent with sediment input from both the Sable Subbasin region and from across the NW Abenaki margin. Thin-skinned extension associated with increased sedimentation on the upper slope near Evangeline was balanced down-slope by contraction. The "Newburn fold-and-thrust belt" developed as a consequence, and folding of existing structures in Parcels 1 and 2 was rejuvenated.
Schematic paleogeography map for the Logan Canyon Formation and equivalent deepwater strata. In the westernmost Sable Subbasin, sedimentation took place primarily above listric growth faults, where more than 2.5 km of shale dominated strata were encountered by Evangeline H-98. For the first time, shelf clastic systems also prograded beyond the edge of the Jurassic shelf NW of Parcels 1 and 2, renewing sediment input into deepwater from this direction. Recognition of several broad slope canyons is consistent with sediment input from both the Sable Subbasin region and from across the NW Abenaki margin. Thin-skinned extension associated with increased sedimentation on the upper slope near Evangeline was balanced down-slope by contraction. The "Newburn fold-and-thrust belt" developed as a consequence, and folding of existing structures in Parcels 1 and 2 was rejuvenated.
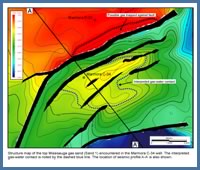
Figure 14
Litho-chronostratigraphic chart adapted from Wade et al. (1993, 1995). On the right the chart shows the interpreted age correspondence of deepwater seismic markers mapped by Shell (NS24-S06-01E/02E) and by the CNSOPB. Age designations are based primarily on ties to Newburn H-23. Note that the age assignments of the J265 and J280 markers are speculative.
Litho-chronostratigraphic chart adapted from Wade et al. (1993, 1995). On the right the chart shows the interpreted age correspondence of deepwater seismic markers mapped by Shell (NS24-S06-01E/02E) and by the CNSOPB. Age designations are based primarily on ties to Newburn H-23. Note that the age assignments of the J265 and J280 markers are speculative.
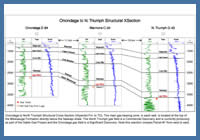
Figure 15
Regional seismic line A - A'. The line is arranged roughly NNE (right) to SSW (left) and crosses the Missisauga and Logan Canyon formations and their seaward equivalents. West of Alma, Missisauga equivalent strata are characterized by a series of topsets to foresets that record the southward advance of delta systems adjacent to the Abenaki carbonate bank. These strata believed to pass seaward into a series of submarine fans deposited above local steps on the middle to lower slope in the areas of Parcels 1 and 2. See Figures 10-13 for location and text for details.
Regional seismic line A - A'. The line is arranged roughly NNE (right) to SSW (left) and crosses the Missisauga and Logan Canyon formations and their seaward equivalents. West of Alma, Missisauga equivalent strata are characterized by a series of topsets to foresets that record the southward advance of delta systems adjacent to the Abenaki carbonate bank. These strata believed to pass seaward into a series of submarine fans deposited above local steps on the middle to lower slope in the areas of Parcels 1 and 2. See Figures 10-13 for location and text for details.
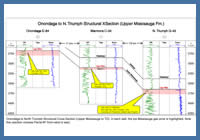
Figure 16
Seismic line B - B' crossing the south-prograding topsets and foresets of the Lower to Upper Missisauga Formation and lower Logan Canyon Formation. These deltaic systems are interpreted to be the primary source for coarse clastics supplied via canyons into Parcels 1 and 2. See Figures 10-13 for location.
Seismic line B - B' crossing the south-prograding topsets and foresets of the Lower to Upper Missisauga Formation and lower Logan Canyon Formation. These deltaic systems are interpreted to be the primary source for coarse clastics supplied via canyons into Parcels 1 and 2. See Figures 10-13 for location.
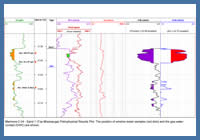
Figure 17
Schematic well correlation panel showing the primary sand-prone intervals in the Missisauga Formation and lowermost Logan Canyon Formation (lower part of the Cree Member), correlated to equivalent strata at Newburn H-23 and a hypothetical well located in the centre of Parcel 2. Note that down-to-the-basin listric growth faults south of Alma F-67 are not shown, nor are the thrusted anticlines seaward of Newburn H-23 (that developed in response to upslope extension). These structures, which can be seen in seismic transect A-A', were particularly active after deposition of the Upper Missisauga Formation. A salt cored Jurassic high formed a positive bathymetric element at Alma F-67 that caused thinning of Berriasian to Hauterivian prodelta shales at this location. This structure, combined with the positive relief of the Abenaki platform, is interpreted to have directed Lower Missisauga delta progradation toward the south. Not shown on this panel is the Cree I-34 well, which encountered an expanded sand-rich Lower Missisauga section that is believed to be more representative of the southward prograding Lower Missisauga section between Alma F-67 (above the salt-cored high) and Demascota G-32 (above the Abenaki bank). See Figures 10-13 for figure location.
Schematic well correlation panel showing the primary sand-prone intervals in the Missisauga Formation and lowermost Logan Canyon Formation (lower part of the Cree Member), correlated to equivalent strata at Newburn H-23 and a hypothetical well located in the centre of Parcel 2. Note that down-to-the-basin listric growth faults south of Alma F-67 are not shown, nor are the thrusted anticlines seaward of Newburn H-23 (that developed in response to upslope extension). These structures, which can be seen in seismic transect A-A', were particularly active after deposition of the Upper Missisauga Formation. A salt cored Jurassic high formed a positive bathymetric element at Alma F-67 that caused thinning of Berriasian to Hauterivian prodelta shales at this location. This structure, combined with the positive relief of the Abenaki platform, is interpreted to have directed Lower Missisauga delta progradation toward the south. Not shown on this panel is the Cree I-34 well, which encountered an expanded sand-rich Lower Missisauga section that is believed to be more representative of the southward prograding Lower Missisauga section between Alma F-67 (above the salt-cored high) and Demascota G-32 (above the Abenaki bank). See Figures 10-13 for figure location.
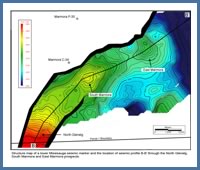
Figure 18
Perspective views of, and a coherence time-slice through, the middle Huckleberry Canyon located west of Alma. See Figures 10-13 for figure location.
Perspective views of, and a coherence time-slice through, the middle Huckleberry Canyon located west of Alma. See Figures 10-13 for figure location.
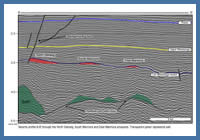
Figure 19
Seismic line C - C' crossing roughly normal to the direction of progradation of the Lower and Upper Missisauga Formations, and lowermost Logan Canyon Formation. Several erosional features are recognized above the topsets. The most prominent are associated with the Huckleberry canyon system located near the intersection of the Abenaki carbonate bank and southward prograding Lower Cretaceous delta systems. These canyons are interpreted to form the conduits for clastics funneled into deepwater in the areas of Parcels 1 and 2. See Figures 10-13 for figure location, and Figure 18 for a perspective view of the middle Huckleberry Canyon.
Seismic line C - C' crossing roughly normal to the direction of progradation of the Lower and Upper Missisauga Formations, and lowermost Logan Canyon Formation. Several erosional features are recognized above the topsets. The most prominent are associated with the Huckleberry canyon system located near the intersection of the Abenaki carbonate bank and southward prograding Lower Cretaceous delta systems. These canyons are interpreted to form the conduits for clastics funneled into deepwater in the areas of Parcels 1 and 2. See Figures 10-13 for figure location, and Figure 18 for a perspective view of the middle Huckleberry Canyon.
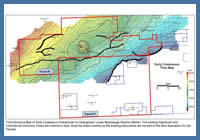
Figure 20
Photos of sidewall cores from the Newburn H-23 well history report (Chevron et al., 2002).
Photos of sidewall cores from the Newburn H-23 well history report (Chevron et al., 2002).
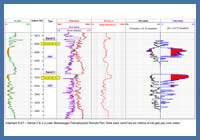
Figure 21
Amplitude extraction from the K140 marker showing an Aptian(?) submarine channel system (on the eastern flank of the Big Thrum prospect - Parcel 2) and corresponding submarine fan deposited above a local step on the middle to lower slope (northern part of the Crows Neck prospect - Parcel 1). A representative seismic profile across the eastern flank of the 'Big Thrum' prospect (line X-X') shows the development of submarine channels at several stratigraphic levels in Lower Cretaceous strata.
Amplitude extraction from the K140 marker showing an Aptian(?) submarine channel system (on the eastern flank of the Big Thrum prospect - Parcel 2) and corresponding submarine fan deposited above a local step on the middle to lower slope (northern part of the Crows Neck prospect - Parcel 1). A representative seismic profile across the eastern flank of the 'Big Thrum' prospect (line X-X') shows the development of submarine channels at several stratigraphic levels in Lower Cretaceous strata.
Figure Captions:
Figure 10. Schematic paleogeography map for the Jurassic, showing the Abenaki carbonate platform along the edge of the stable continental margin. Three main facies zones are shown, corresponding to an inner low energy shelf, an outer high energy shelf, and the steep foreslope that extends into deepwater (see Kidston et al., 2005 for further details). Coeval with the development of the carbonate bank was the deposition of the Upper Jurassic Mic Mac Formation and its equivalents, consisting of a mix of clastics and carbonates that are thickest in the NE corner of the figure. Significant growth faulting and salt mobilization took place while the Mic Mac Formation was deposited. In the areas of Parcels 1 and 2, a time-thickness map for the J350 and J280 markers shows the distribution of the earliest minibasins above autochthonous salt. The minibasins are assumed to contain Jurassic strata composed of the deepwater equivalents of the Mic Mac Formation, as well as strata equivalent to the Mohican Formation. Sediment input into deepwater is presumed to be normal or sub-normal to the steep Abenaki slope. Salt outlines on this map are highly schematic. See text for details.
Figure 11. Schematic paleogeography map for the lowermost Cretaceous. The map shows the southward progradation of the sand-prone Lower Missisauga Formation along the Jurassic carbonate bank. Several canyons are present near the outer shelf, and these are presumed to have supplied clastics to the south and southwest where the J280 to K230 time-thickness map is thickest. Clastics are also inferred to have been supplied down the carbonate slope. This interpretation is based in part on an amplitude extraction from the J280 marker which appears to show a series of high amplitude interfingering submarine fans sourced from the NW. Salt outlines on this map are highly schematic. Refer to text for details.
Figure 12. Schematic paleogeography map for sand-prone Missisauga and lowermost Logan Canyon Formations and equivalent strata. Local preservation of offlap breaks (i.e. the transition from topsets to foresets) indicates these sandy systems built progressively toward the south. Recognition of canyons west of Alma implies that clastics associated with these delta systems were also transported into deepwater, an idea confirmed by Newburn H-23 which penetrated several thin intervals of sandstone to pebble conglomerates. A time-thickness map for the K230 to K140 interval suggests the primary sediment source for Parcels 1 and 2 was from the westernmost Sable Subbasin. This interval is interpreted to have reservoir potential, with the thickest sediment accumulations taking place in a complex network of minibasins believed to occupy a mid to lower slope position. Refer to text for details.
Figure 13. Schematic paleogeography map for the Logan Canyon Formation and equivalent deepwater strata. In the westernmost Sable Subbasin, sedimentation took place primarily above listric growth faults, where more than 2.5 km of shale dominated strata were encountered by Evangeline H-98. For the first time, shelf clastic systems also prograded beyond the edge of the Jurassic shelf NW of Parcels 1 and 2, renewing sediment input into deepwater from this direction. Recognition of several broad slope canyons is consistent with sediment input from both the Sable Subbasin region and from across the NW Abenaki margin. Thin-skinned extension associated with increased sedimentation on the upper slope near Evangeline was balanced down-slope by contraction. The “Newburn fold-and-thrust belt” developed as a consequence, and folding of existing structures in Parcels 1 and 2 was rejuvenated.
Figure 14. Litho-chronostratigraphic chart adapted from Wade et al. (1993, 1995). On the right the chart shows the interpreted age correspondence of deepwater seismic markers mapped by Shell (NS24-S06-01E/02E) and by the CNSOPB. Age designations are based primarily on ties to Newburn H-23. Note that the age assignments of the J265 and J280 markers are speculative.
Figure 15. Regional seismic line A – A’. The line is arranged roughly NNE (right) to SSW (left) and crosses the Missisauga and Logan Canyon formations and their seaward equivalents. West of Alma, Missisauga equivalent strata are characterized by a series of topsets to foresets that record the southward advance of delta systems adjacent to the Abenaki carbonate bank. These strata believed to pass seaward into a series of submarine fans deposited above local steps on the middle to lower slope in the areas of Parcels 1 and 2. See Figures 10-13 for location and text for details.
Figure 16. Seismic line B – B’ crossing the south-prograding topsets and foresets of the Lower to Upper Missisauga Formation and lower Logan Canyon Formation. These deltaic systems are interpreted to be the primary source for coarse clastics supplied via canyons into Parcels 1 and 2. See Figures 10-13 for location.
Figure 17. Schematic well correlation panel showing the primary sand-prone intervals in the Missisauga Formation and lowermost Logan Canyon Formation (lower part of the Cree Member), correlated to equivalent strata at Newburn H-23 and a hypothetical well located in the centre of Parcel 2. Note that down-to-the-basin listric growth faults south of Alma F-67 are not shown, nor are the thrusted anticlines seaward of Newburn H-23 (that developed in response to upslope extension). These structures, which can be seen in seismic transect A-A’, were particularly active after deposition of the Upper Missisauga Formation. A salt cored Jurassic high formed a positive bathymetric element at Alma F-67 that caused thinning of Berriasian to Hauterivian prodelta shales at this location. This structure, combined with the positive relief of the Abenaki platform, is interpreted to have directed Lower Missisauga delta progradation toward the south. Not shown on this panel is the Cree I-34 well, which encountered an expanded sand-rich Lower Missisauga section that is believed to be more representative of the southward prograding Lower Missisauga section between Alma F-67 (above the salt-cored high) and Demascota G-32 (above the Abenaki bank). See Figures 10-13 for figure location.
Figure 18. Perspective views of, and a coherence time-slice through, the middle Huckleberry Canyon located west of Alma. See Figures 10-13 for figure location.
Figure 19. Seismic line C – C’ crossing roughly normal to the direction of progradation of the Lower and Upper Missisauga Formations, and lowermost Logan Canyon Formation. Several erosional features are recognized above the topsets. The most prominent are associated with the Huckleberry canyon system located near the intersection of the Abenaki carbonate bank and southward prograding Lower Cretaceous delta systems. These canyons are interpreted to form the conduits for clastics funneled into deepwater in the areas of Parcels 1 and 2. See Figures 10-13 for figure location, and Figure 18 for a perspective view of the middle Huckleberry Canyon.
Figure 20. Photos of sidewall cores from the Newburn H-23 well history report (Chevron et al., 2002).
Figure 21. Amplitude extraction from the K140 marker showing an Aptian(?) submarine channel system (on the eastern flank of the Big Thrum prospect – Parcel 2) and corresponding submarine fan deposited above a local step on the middle to lower slope (northern part of the Crows Neck prospect – Parcel 1). A representative seismic profile across the eastern flank of the ‘Big Thrum’ prospect (line X-X’) shows the development of submarine channels at several stratigraphic levels in Lower Cretaceous strata.