Eastern Scotian Shelf Regional Interpretation
A regional grid consisting of twelve 2D seismic surveys has been interpreted over the NS13-1 Call for Bids area. The varying data density across these surveys requires a gridding interval of at least 700 m by 700 m in order to create continuous time-structure maps. No 3D seismic programs have been collected in this region. For detailed maps and information on the distribution and vintage of the seismic programs see the Data tab.
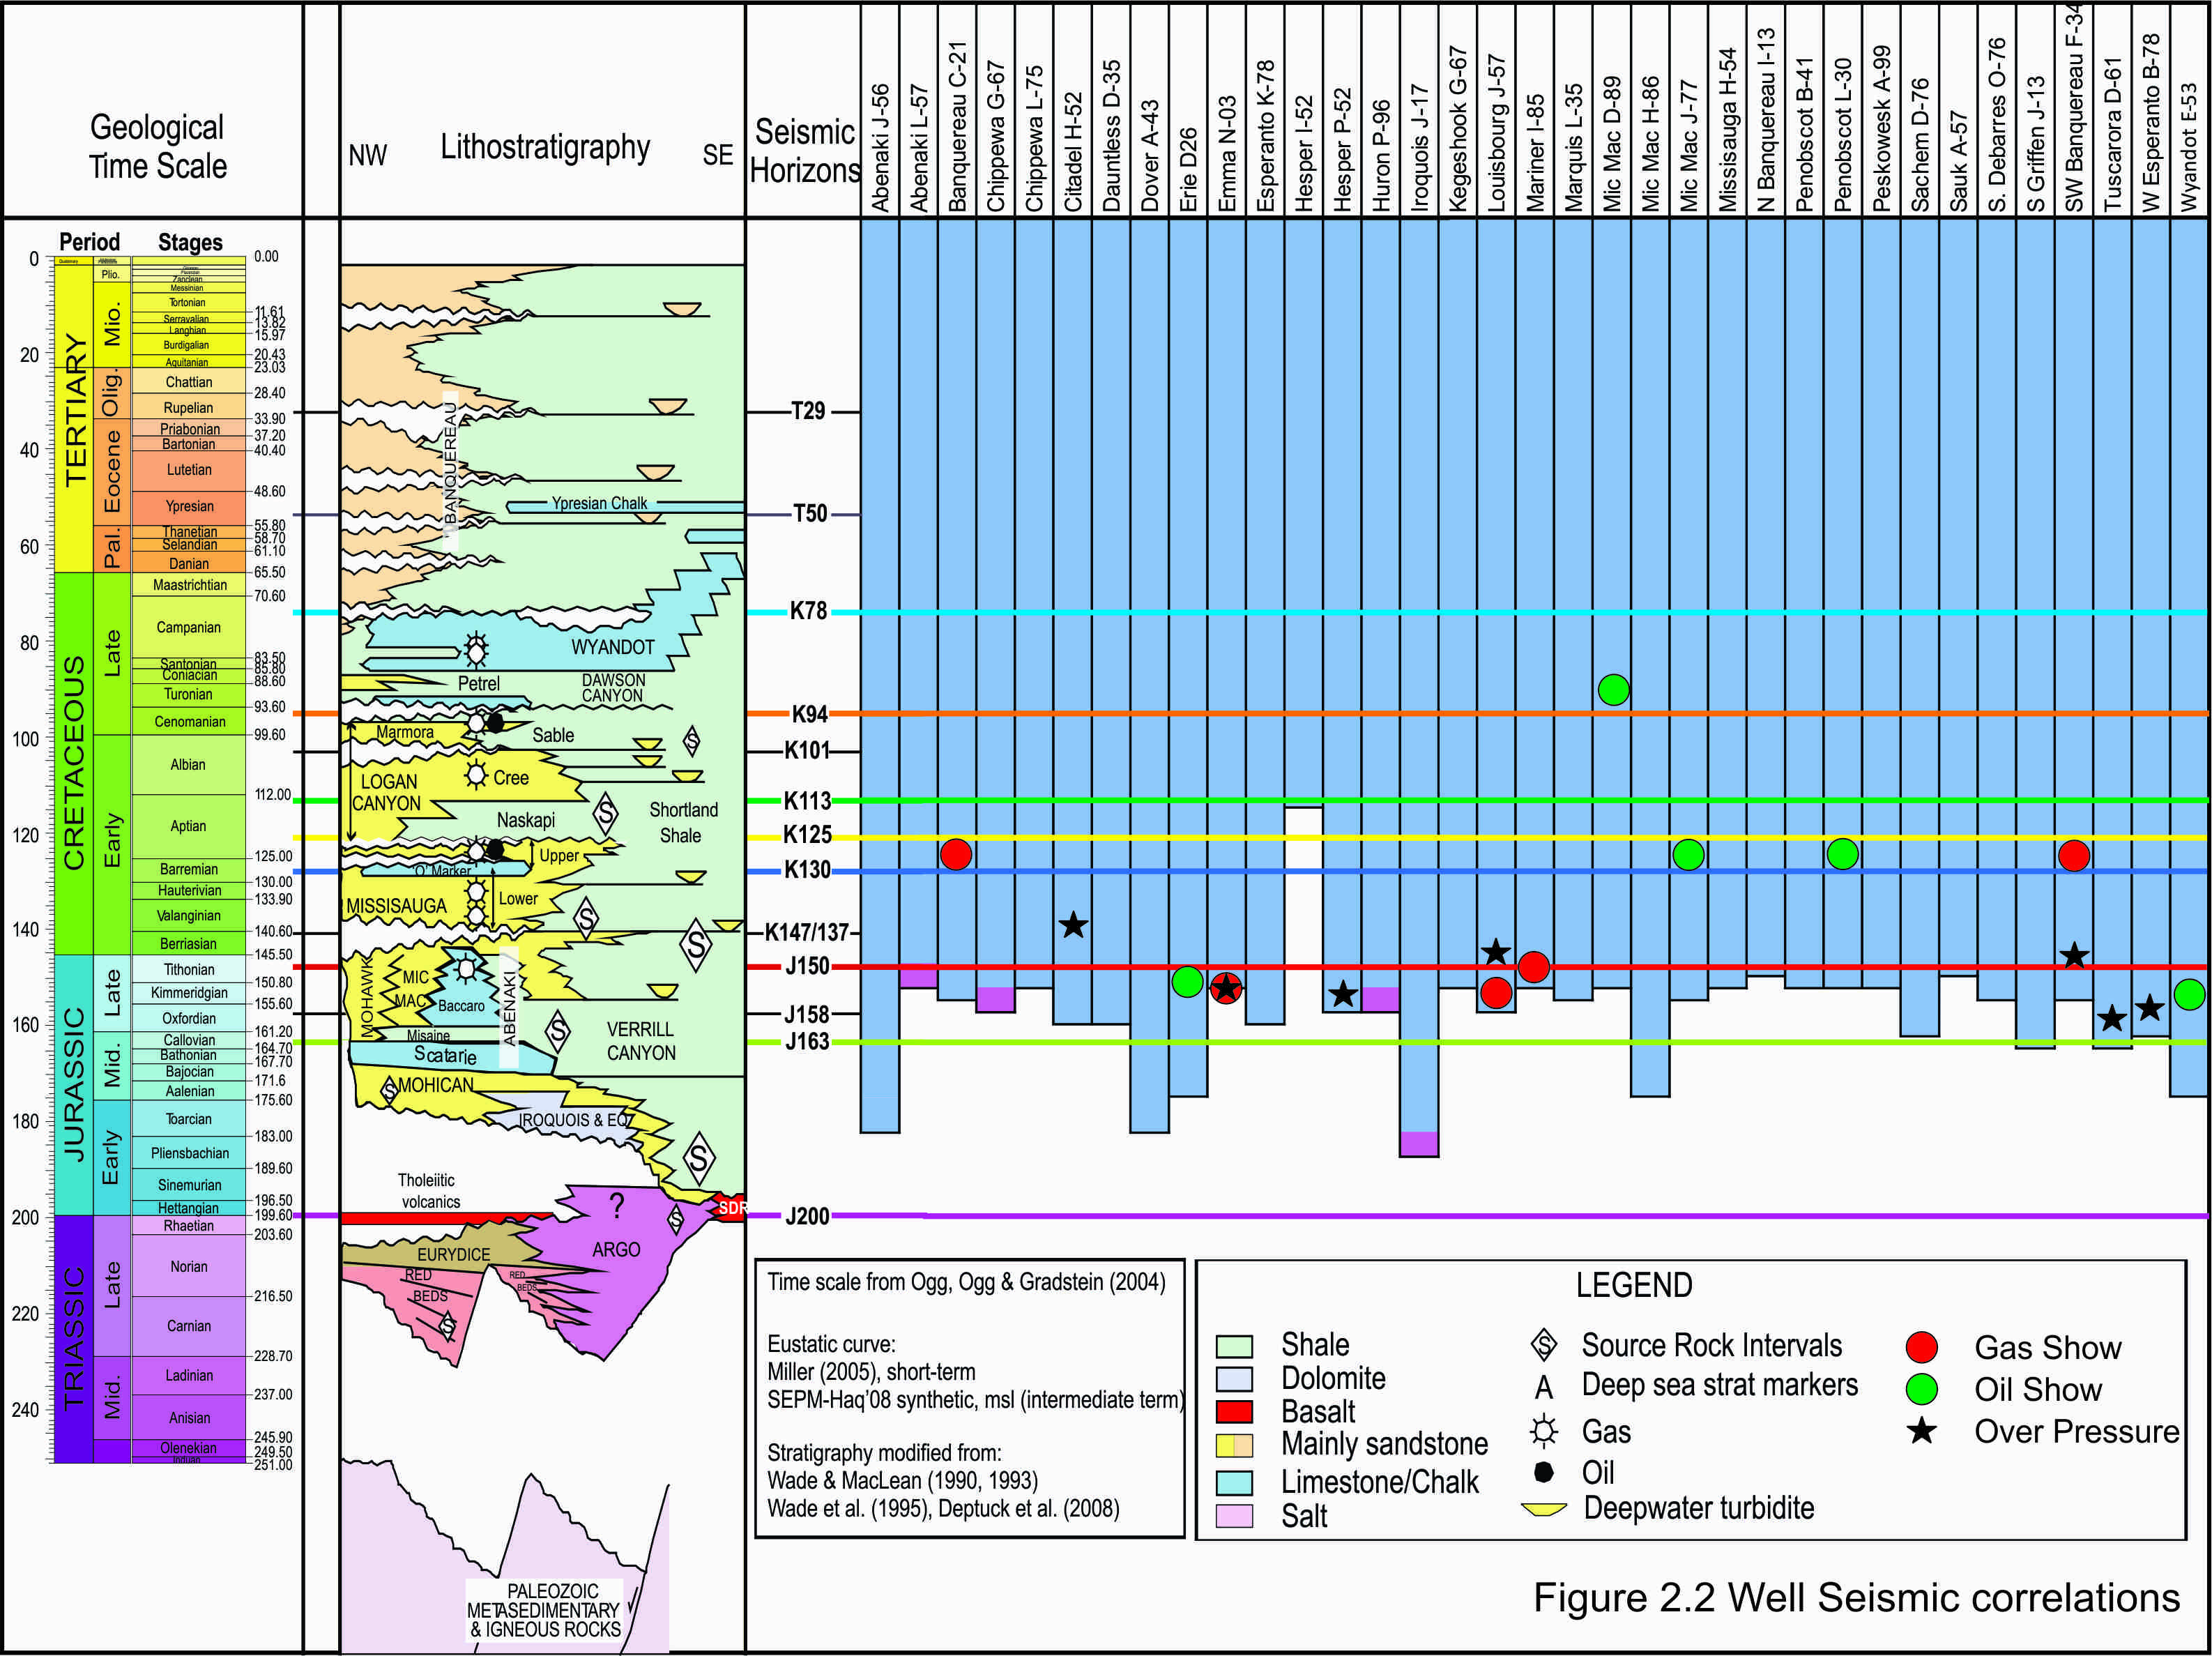
The Scotian Basin stratigraphic column is shown in Figure 2.1. The CNSOPB has adopted the seismic horizon nomenclature proposed in the Play Fairway Analysis. A diagram combining well penetrations within the parcels, geologic time scale, lithostratigraphy and interpreted seismic horizons is shown in Figure 2.2. Numerous wells reached the Jurassic section in the NS13-1 Call for Bids area. The density of well control and the deep penetration depths here allow seismic horizons to be correlated with relatively high confidence down to the Middle Jurassic strata across most of the six parcels.
| The following time-structure maps were created from the seismic interpretation (maps are listed from deepest to shallowest): | ||
| Figure 2.3 | J200 | Synrift to early postrift |
| Figure 2.4 | Autochthonous salt distribution (Argo Fm.) and basin structure | |
| Figure 2.5 | J163 | Middle Jurassic – Top of Scatarie Mb. |
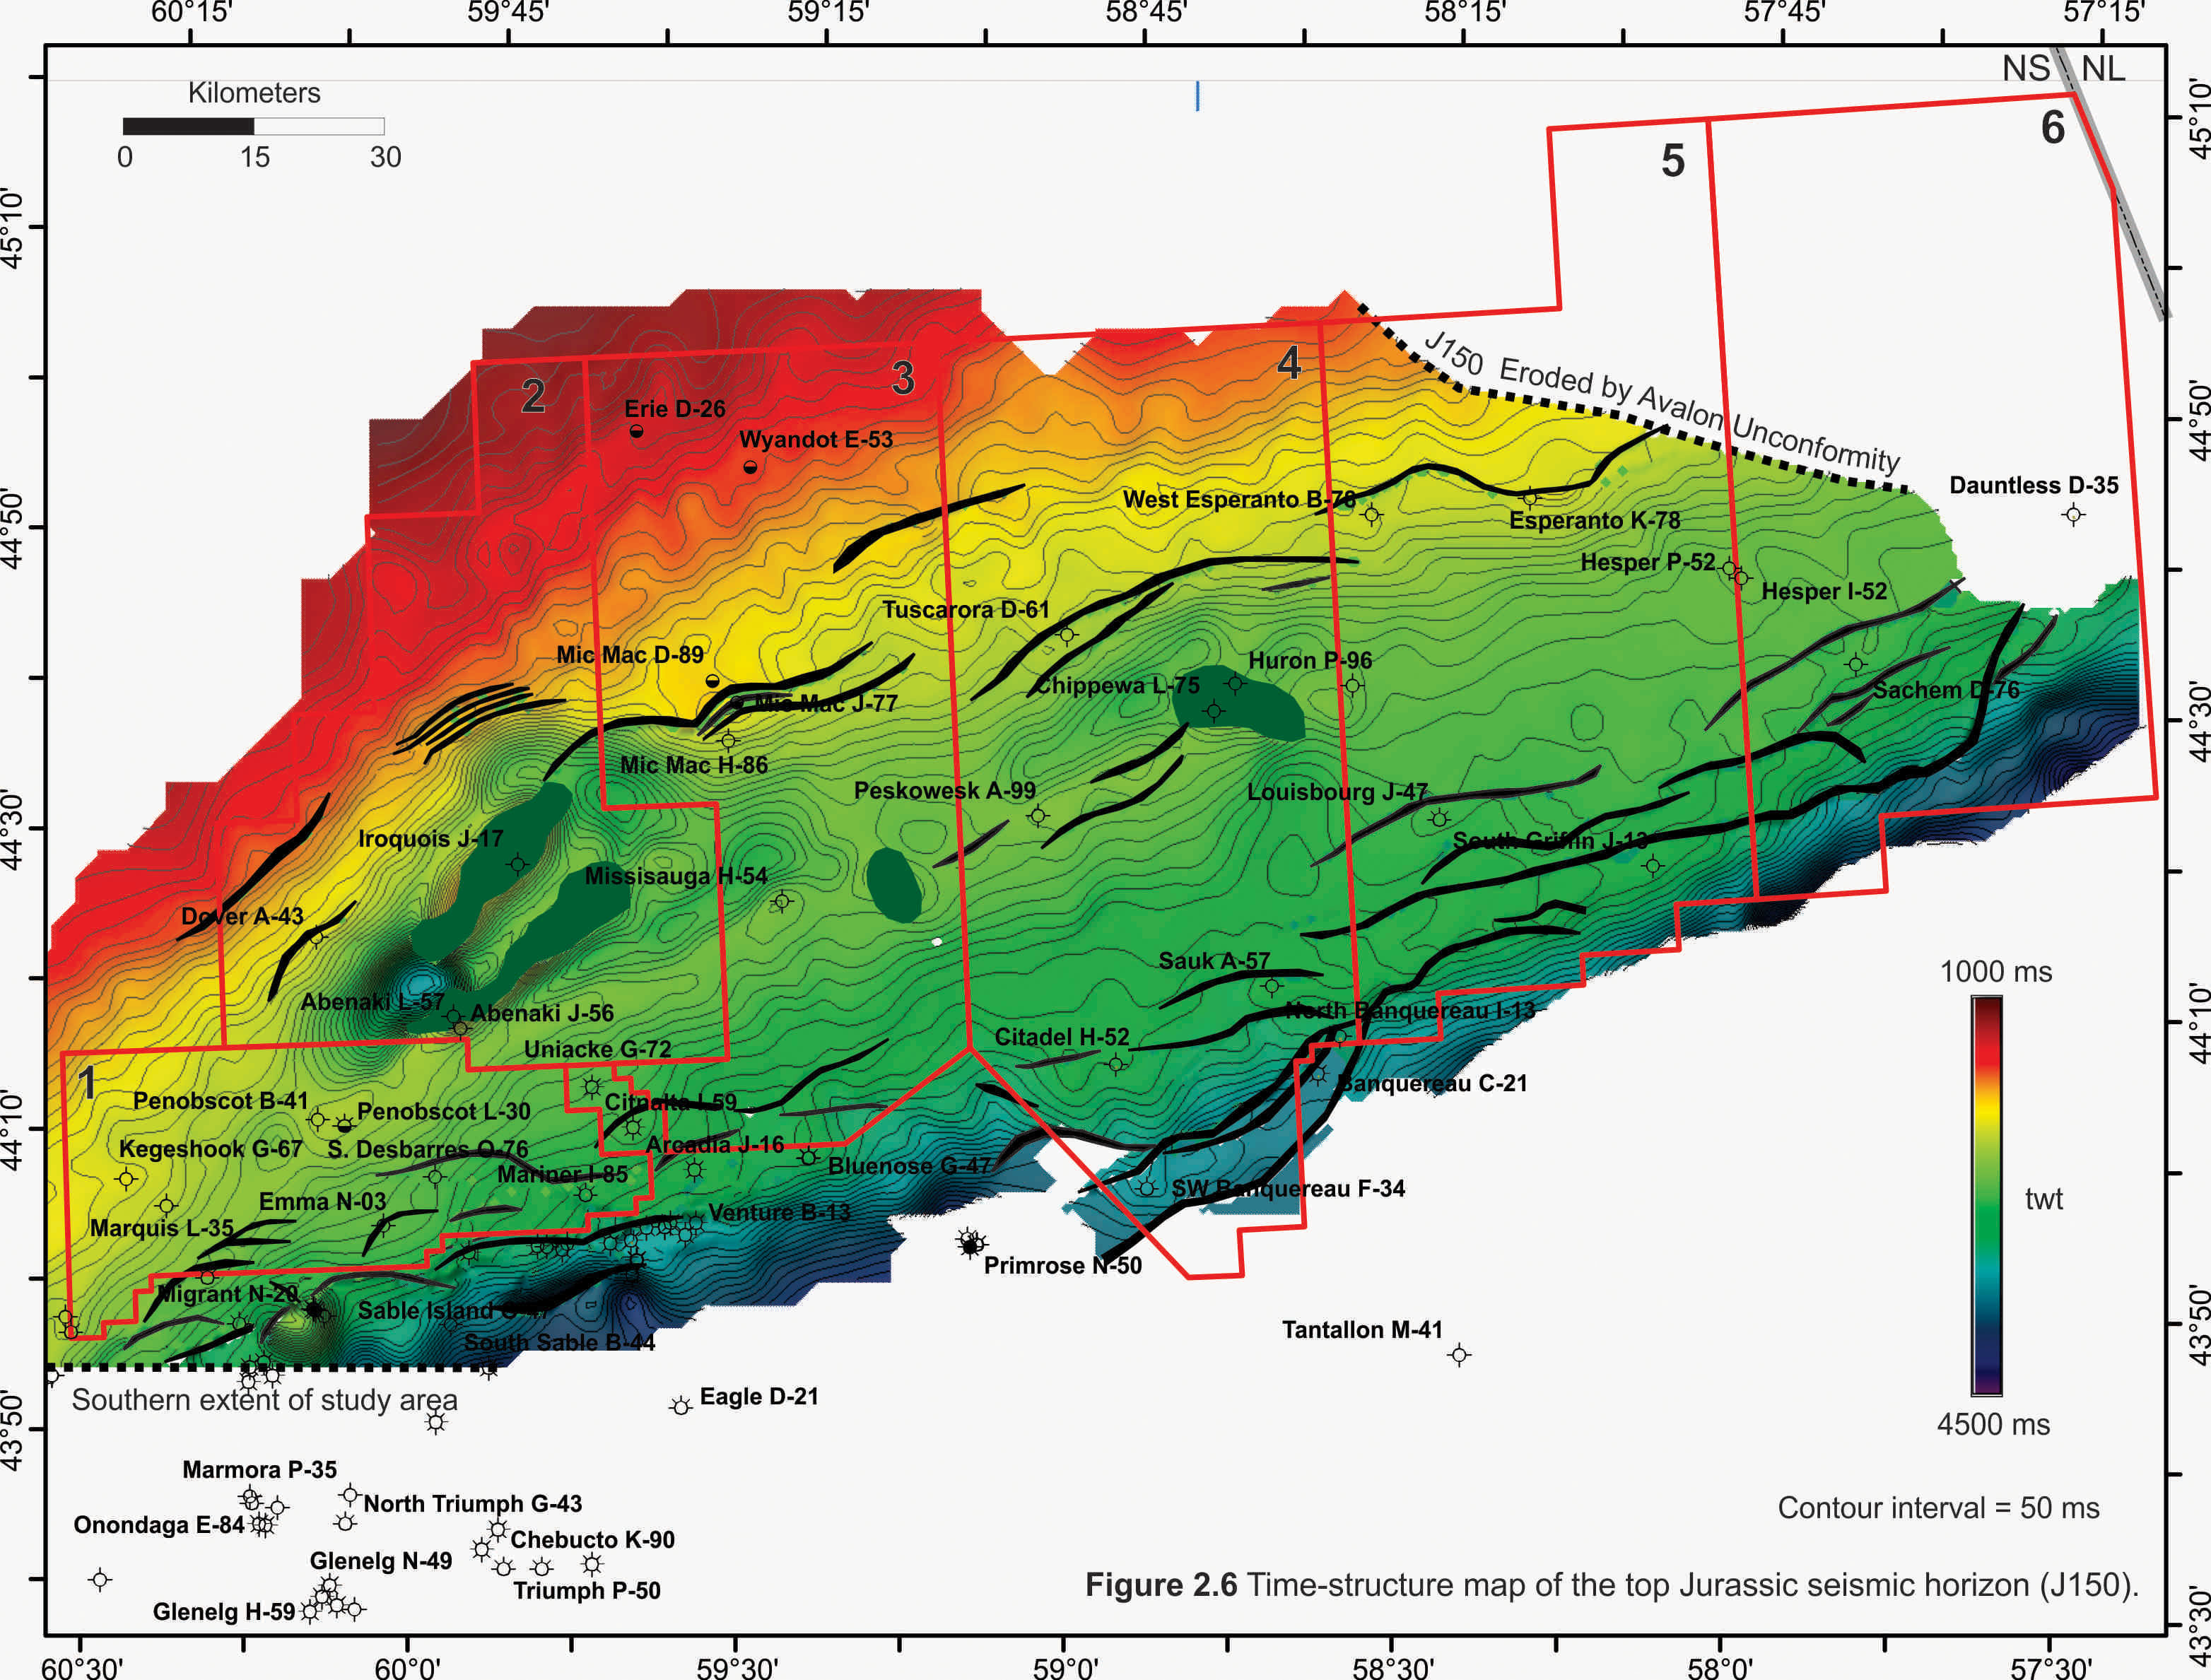
| Figure 2.6 | J150 | Top Jurassic (approx. top Abenaki / Mic Mac Fms.) |
| Figure 2.7 | K130 | Early Cretaceous - O Marker (approx. base of upper Missisauga Fm.) |
| Figure 2.8 | K125 | Early Cretaceous - Top of upper Missisauga Fm. |
| Figure 2.9 | K113 | Early Cretaceous - Top of Naskapi Mb. (Logan Canyon Fm.) |
| Figure 2.10 | K94 | Late Cretaceous - Top of Petrel Mb. |
| Figure 2.11 | K78 | Late Cretaceous - Top of Wyandot Fm. |
| Using these surfaces, the following isochron maps were generated (all maps are in two-way travel-time): | ||
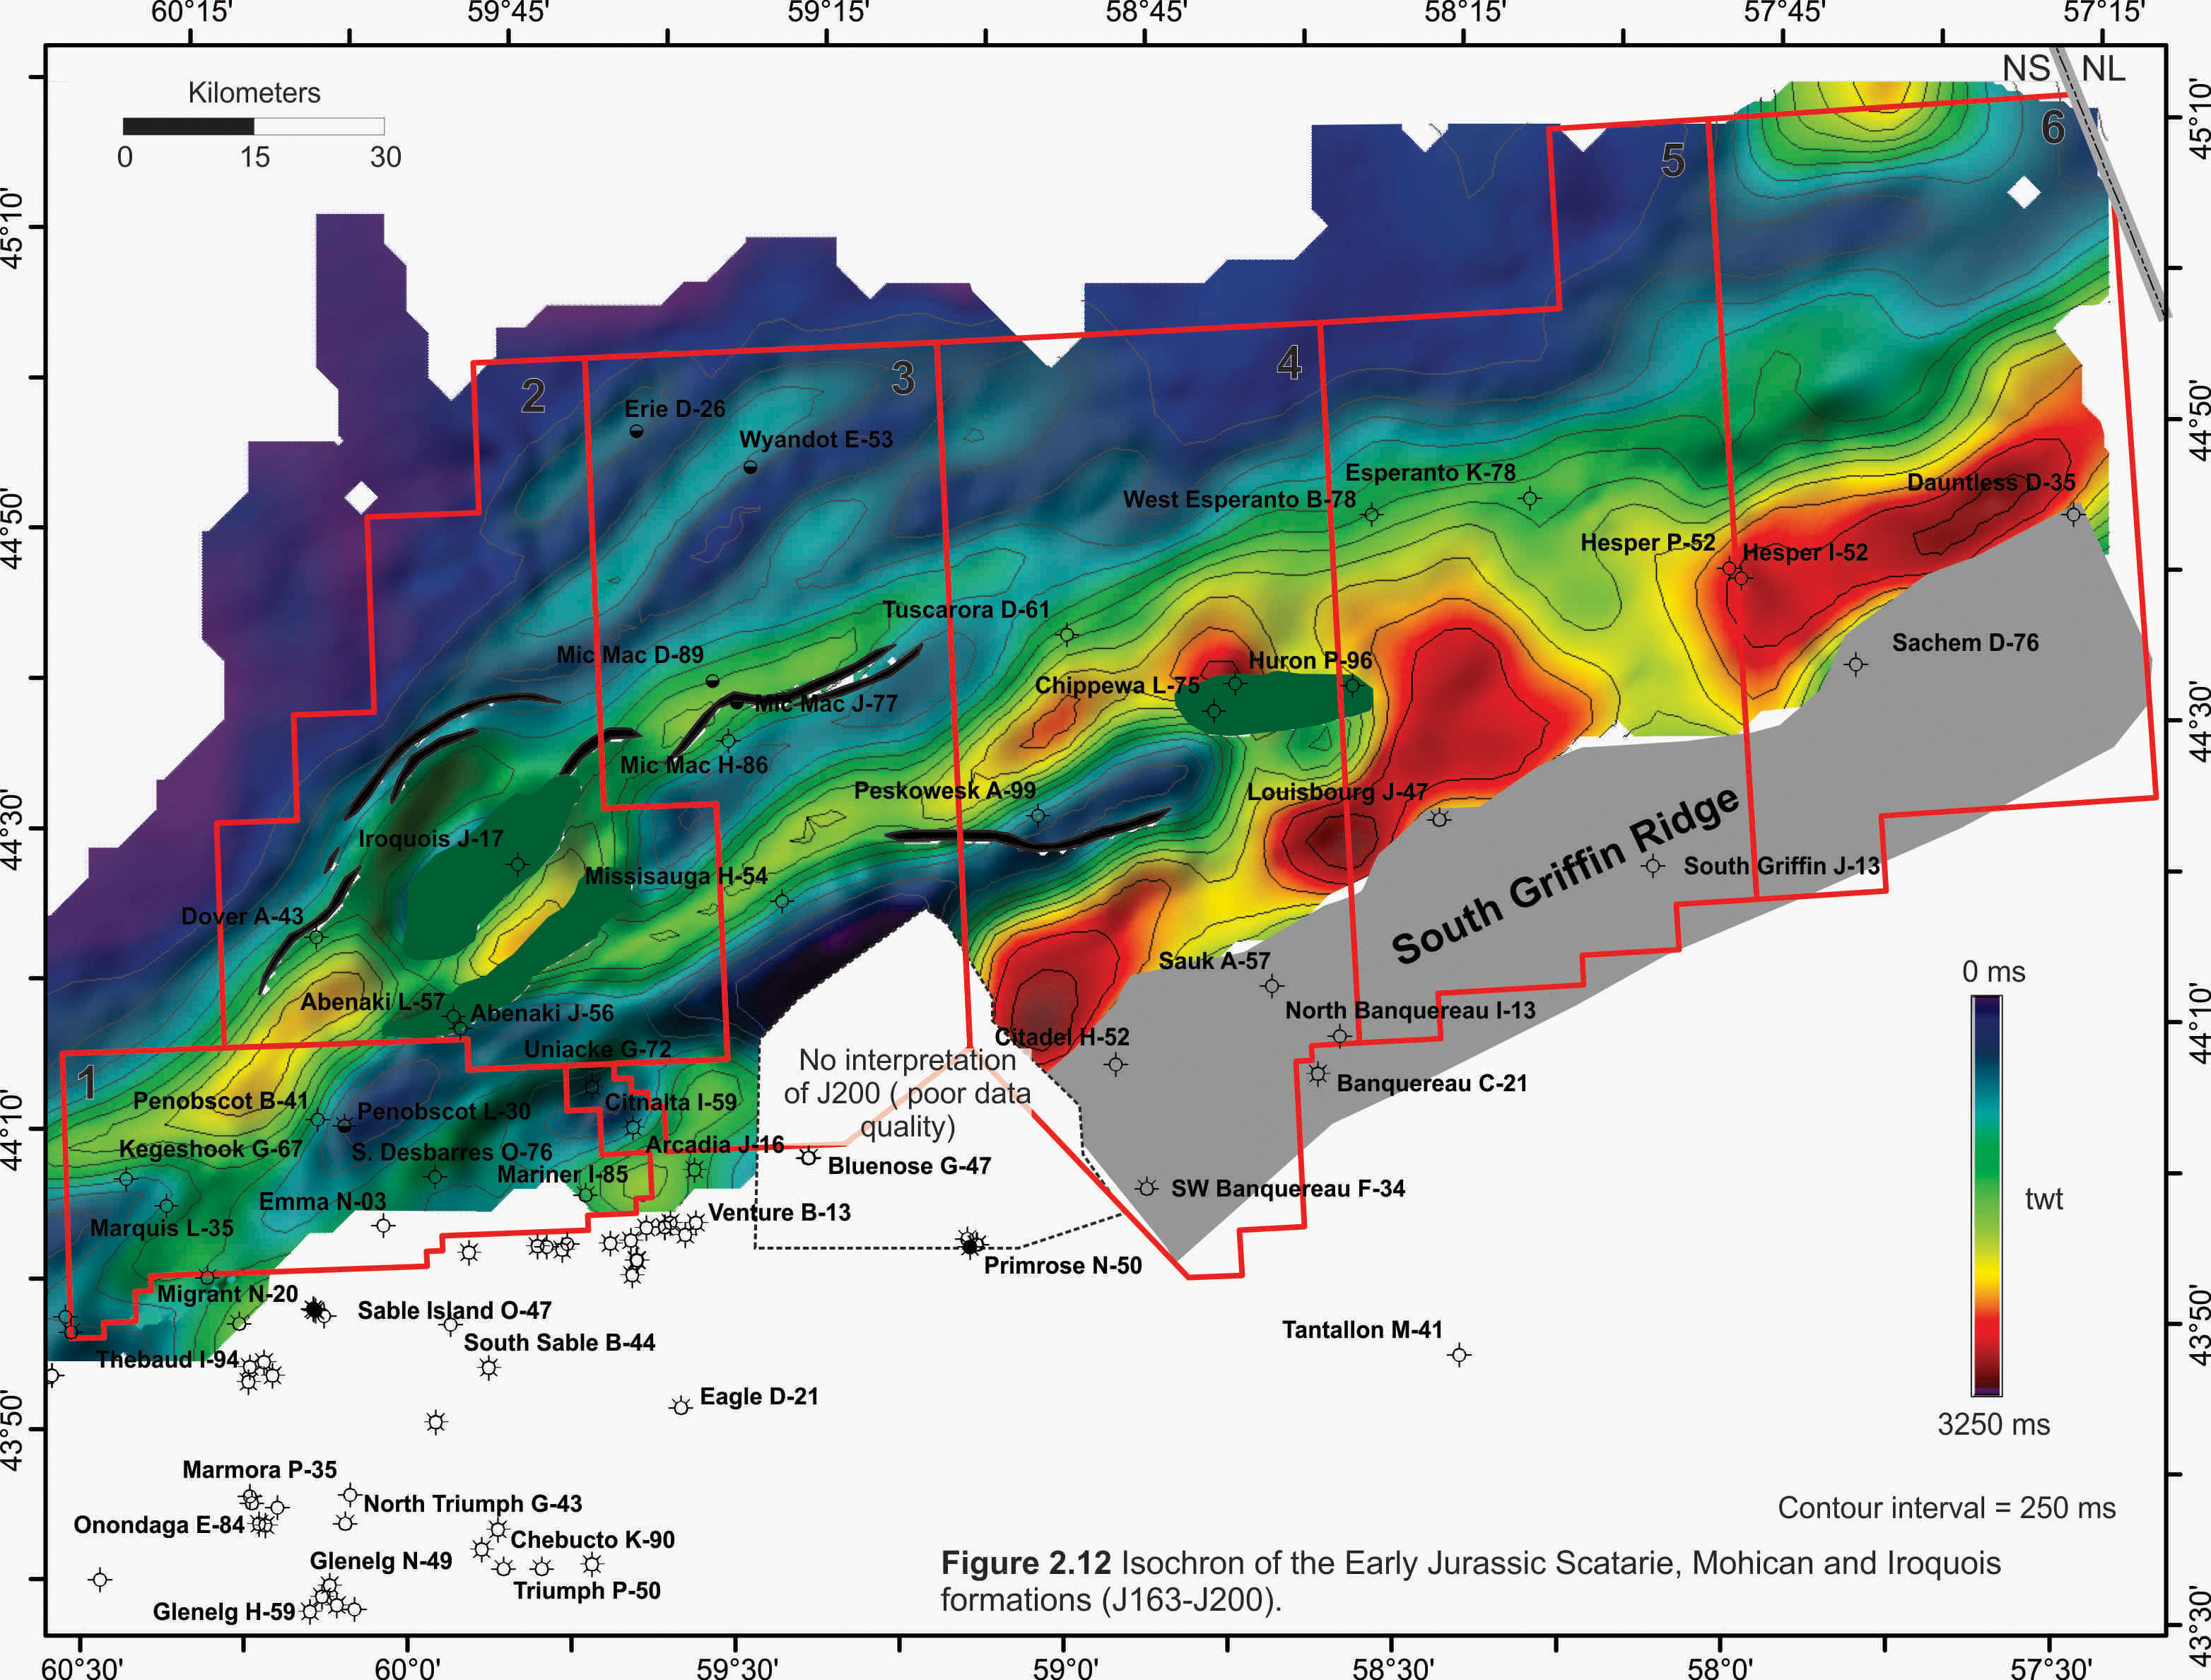
| Figure 2.12 | J163 - J200 | Mohican and Iroquois Fms. Isochron |
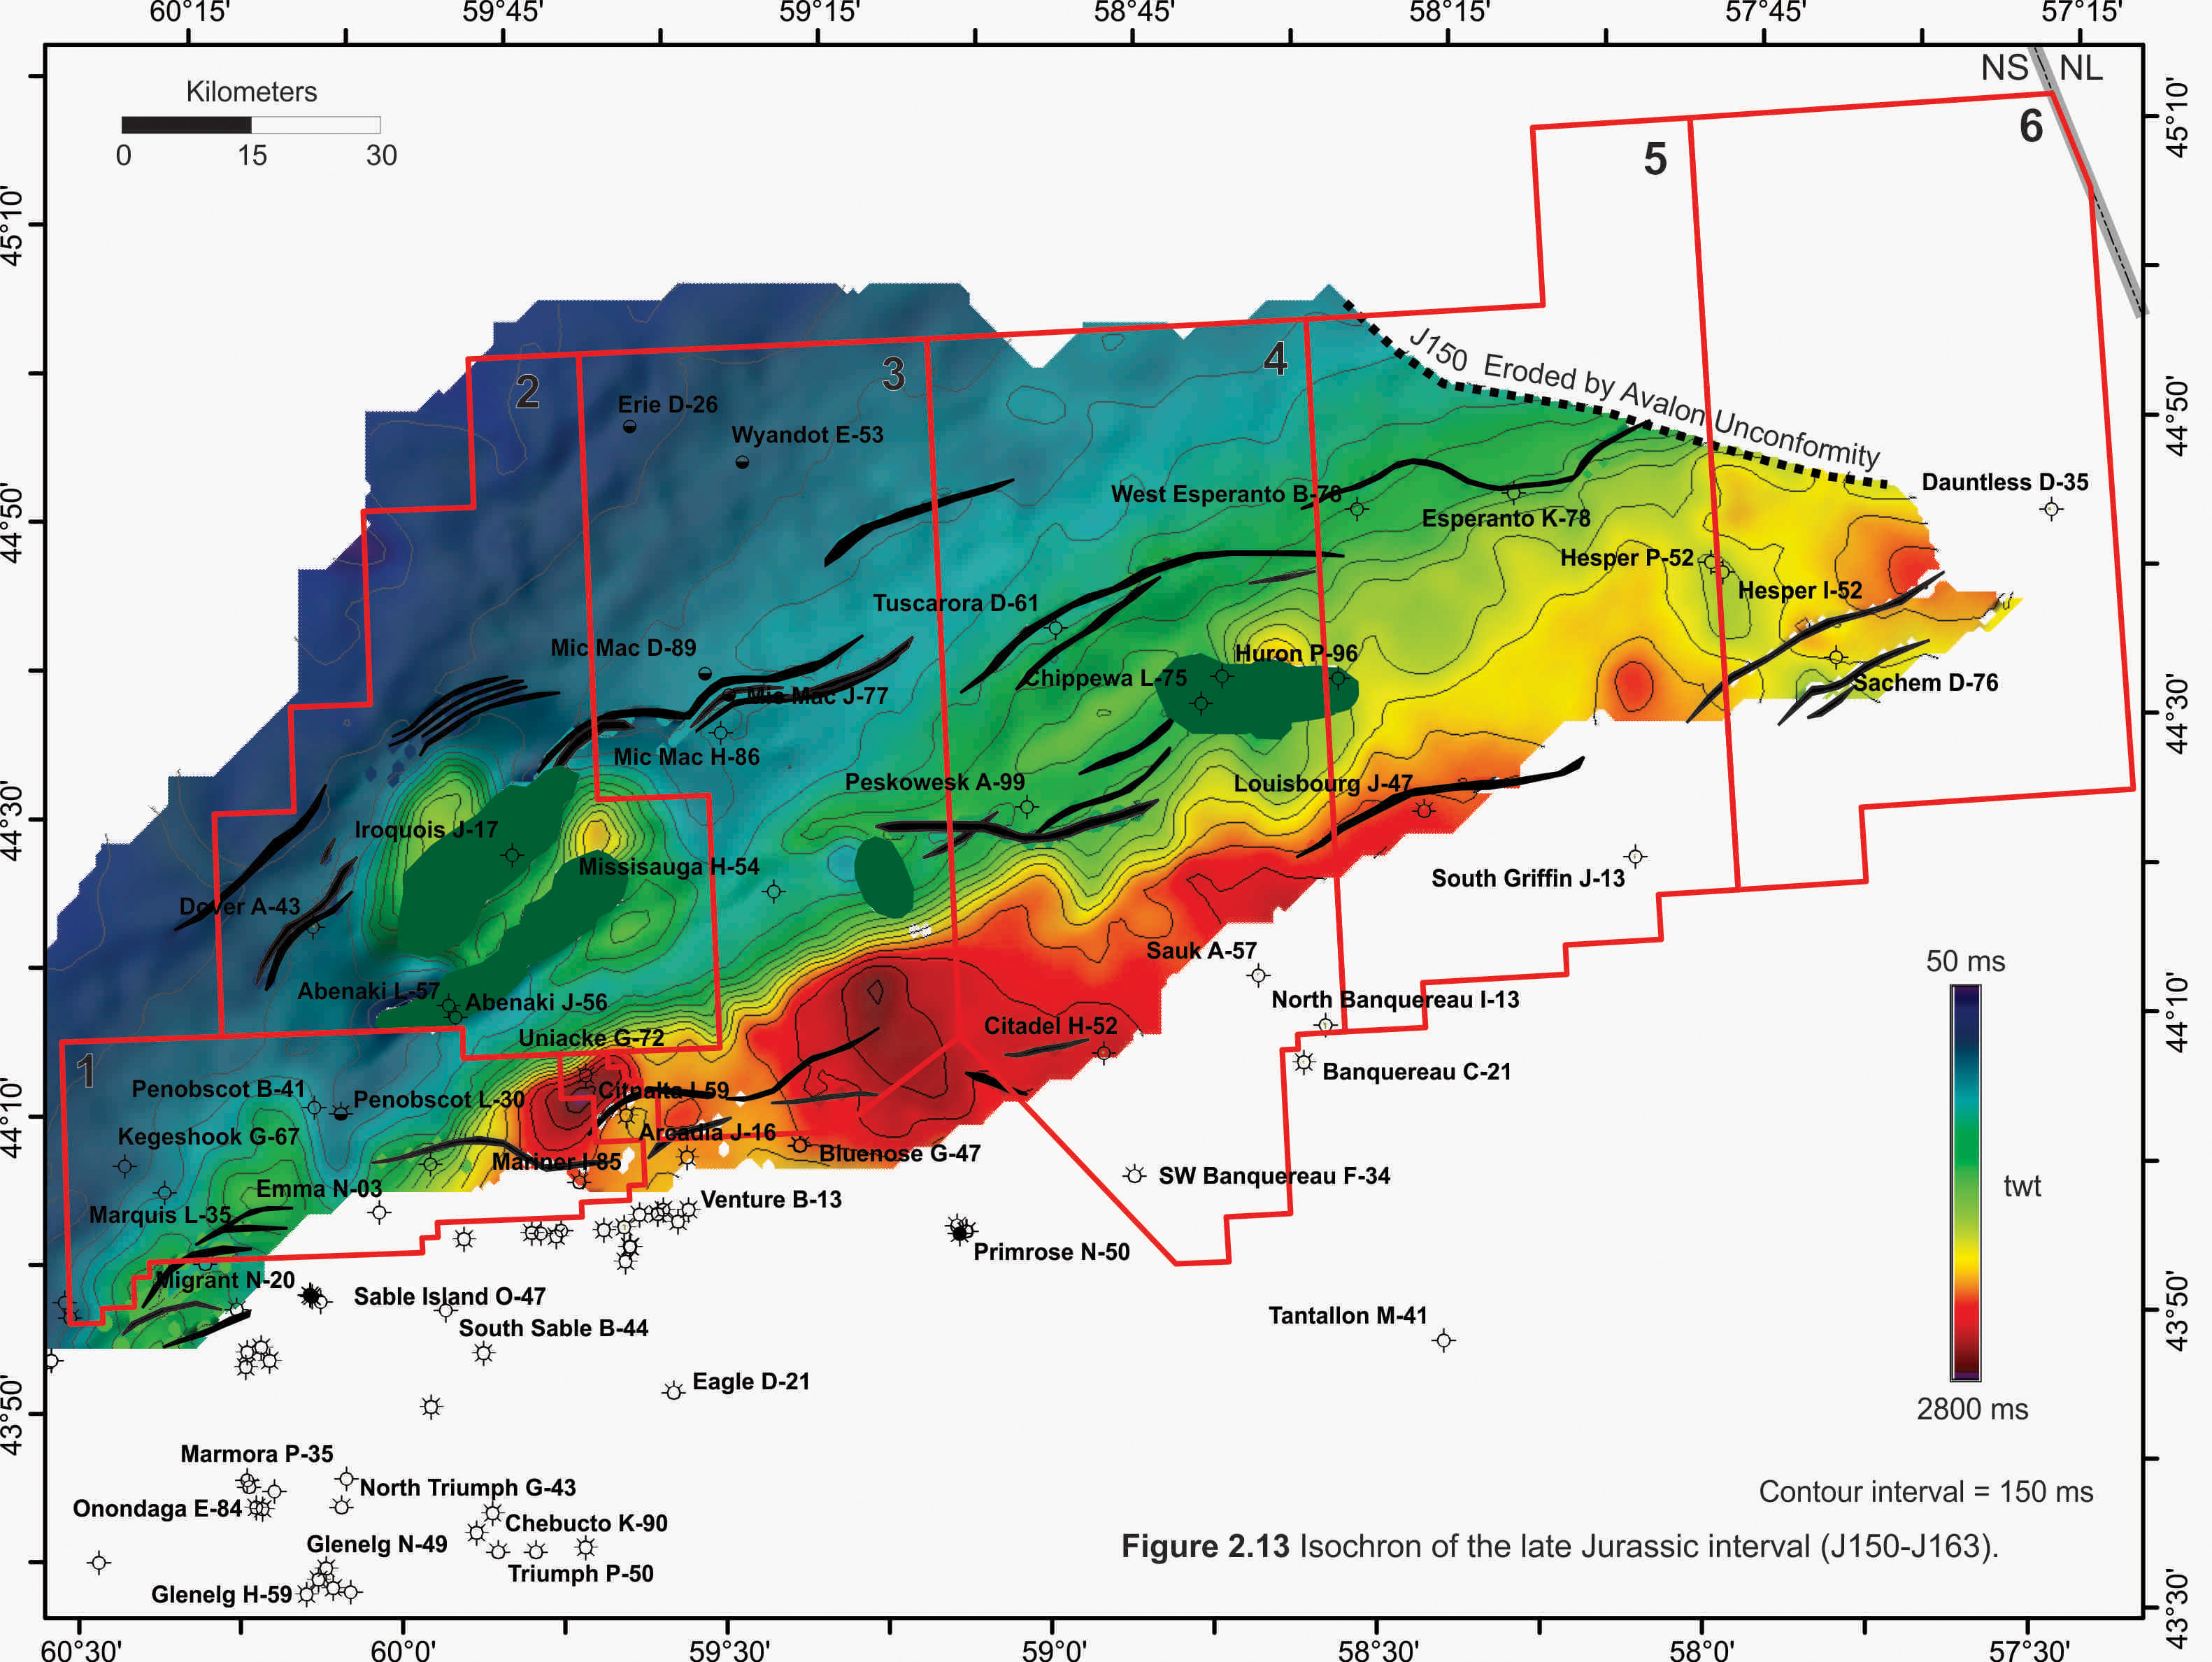
| Figure 2.13 | J150 - J163 | Mic Mac Fm./Baccaro Mb. Isochron |
| Figure 2.14 | J150 - J200 | Jurassic Isochron |
| Figure 2.15 | J130 - K150 | Lower Missisauga Fm. Isochron |
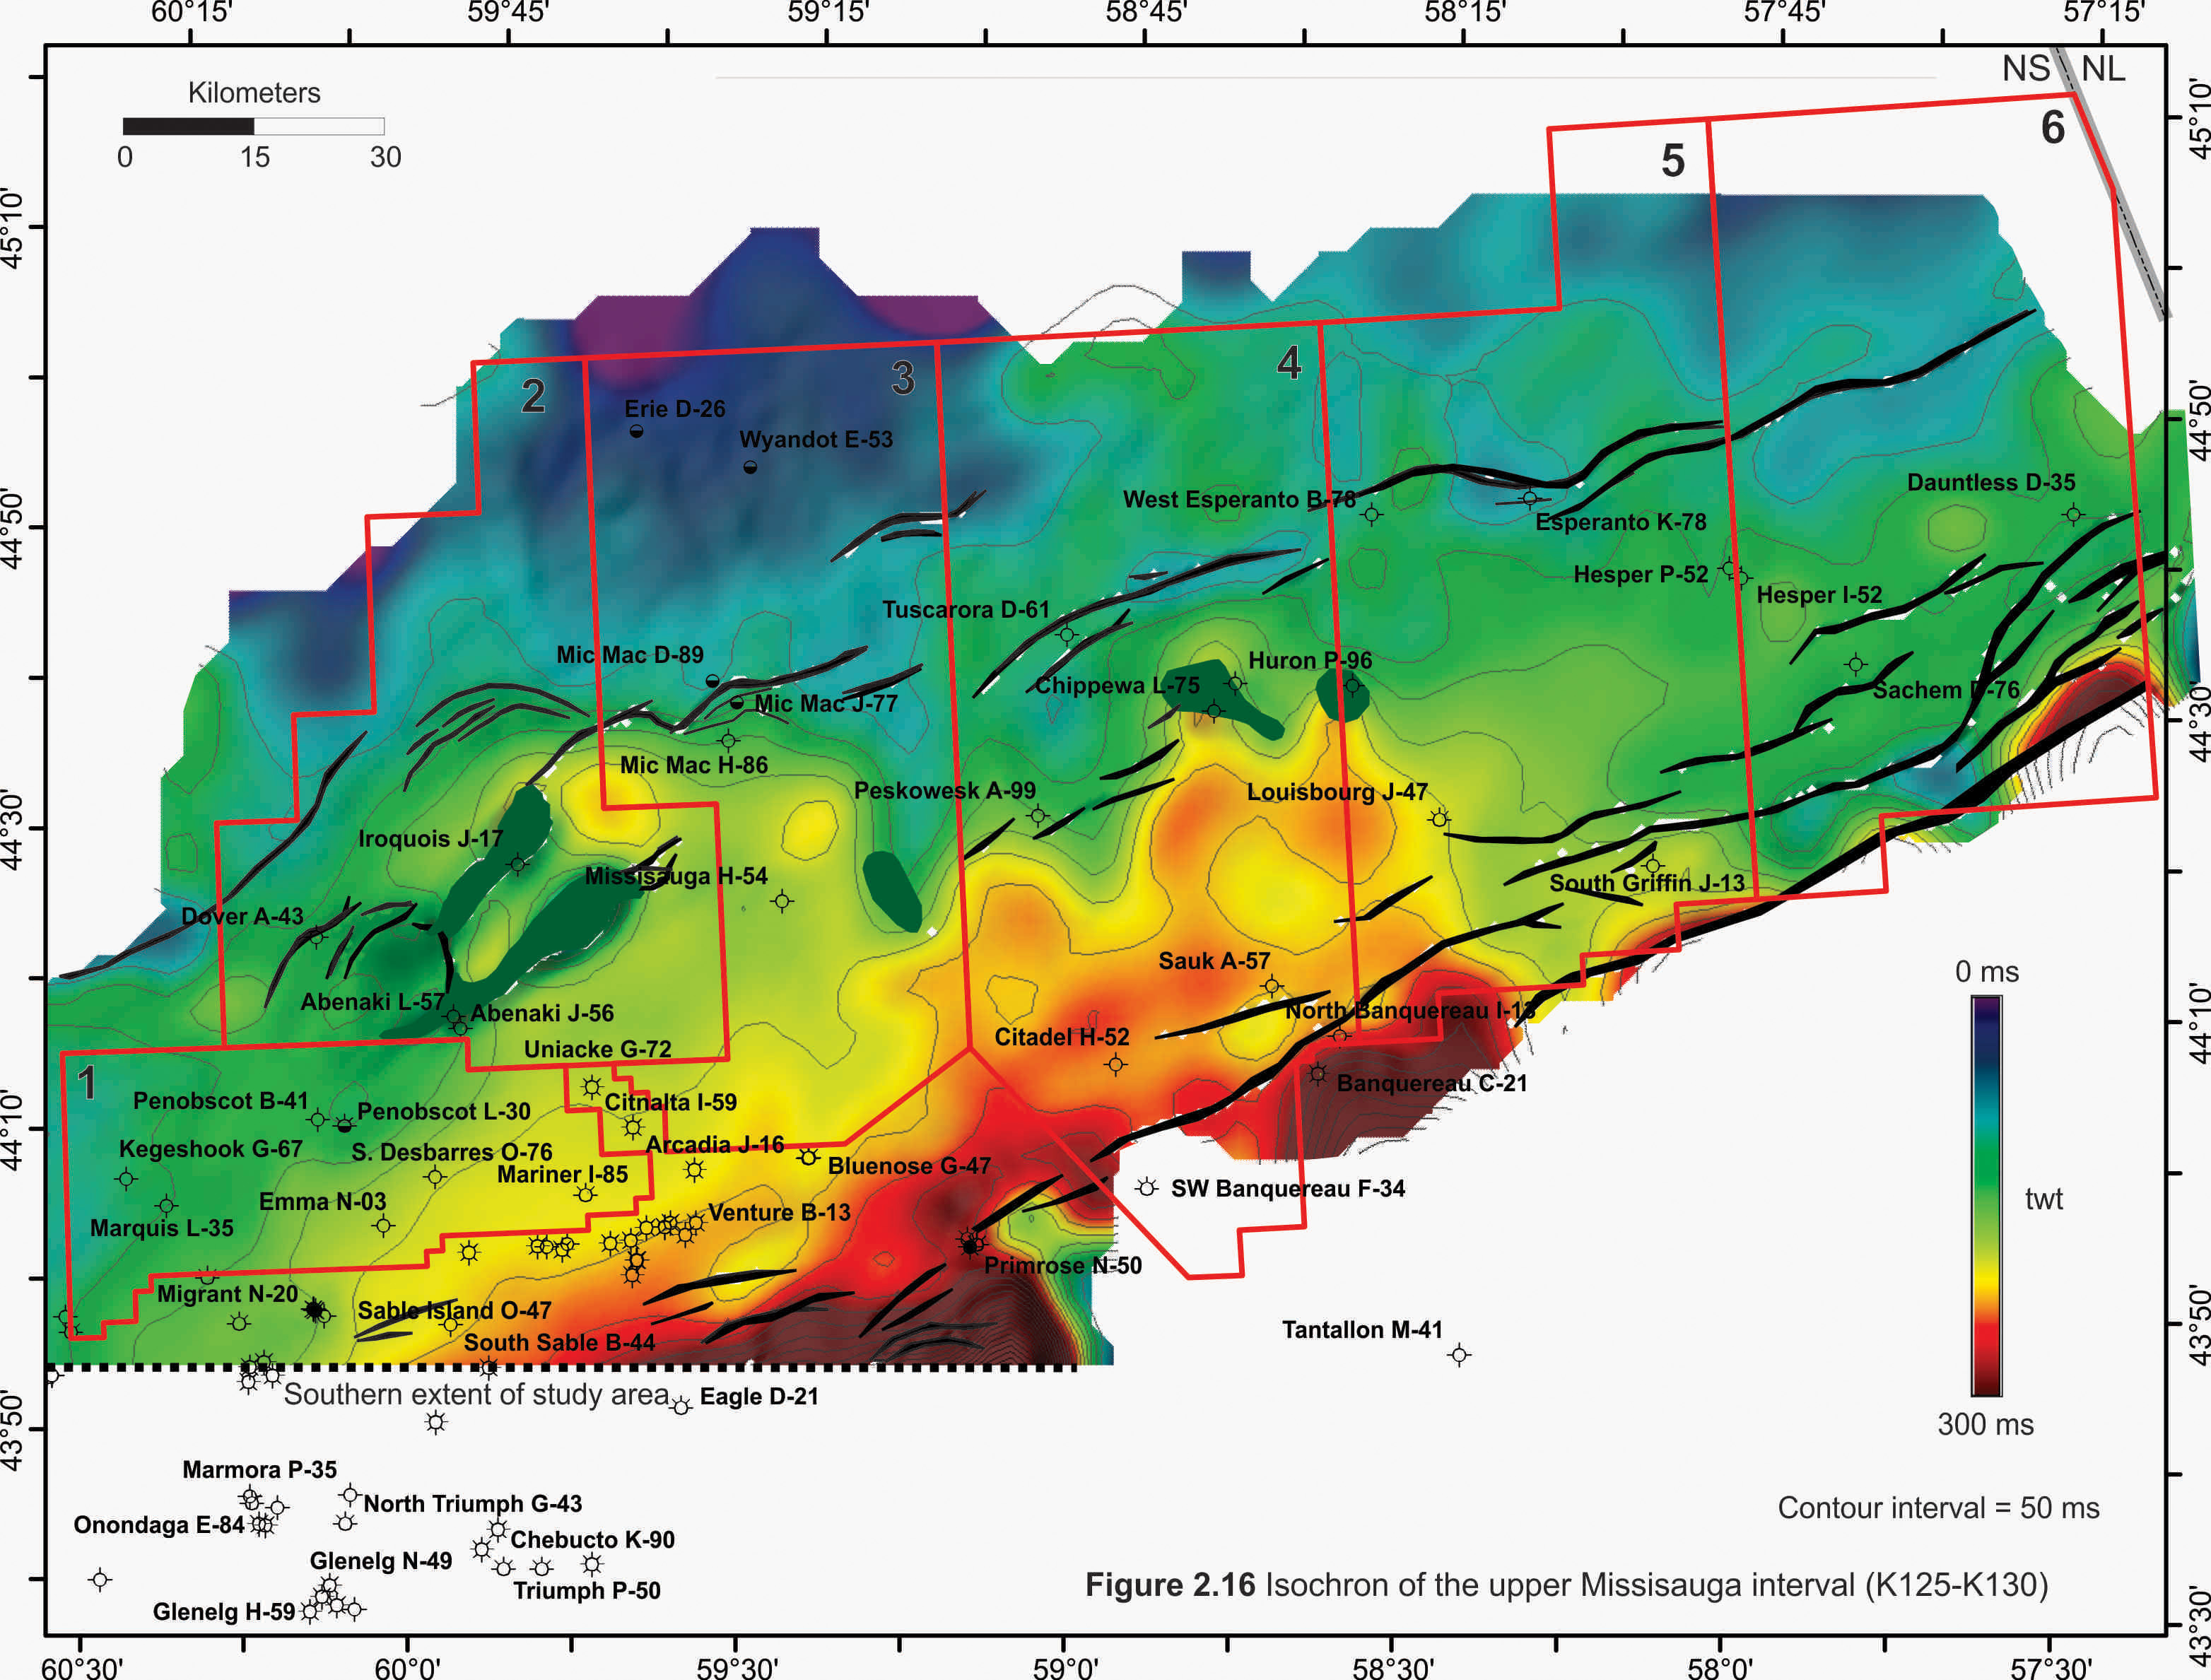
| Figure 2.16 | K125 - K130 | Upper Missisauga Fm. Isochron |
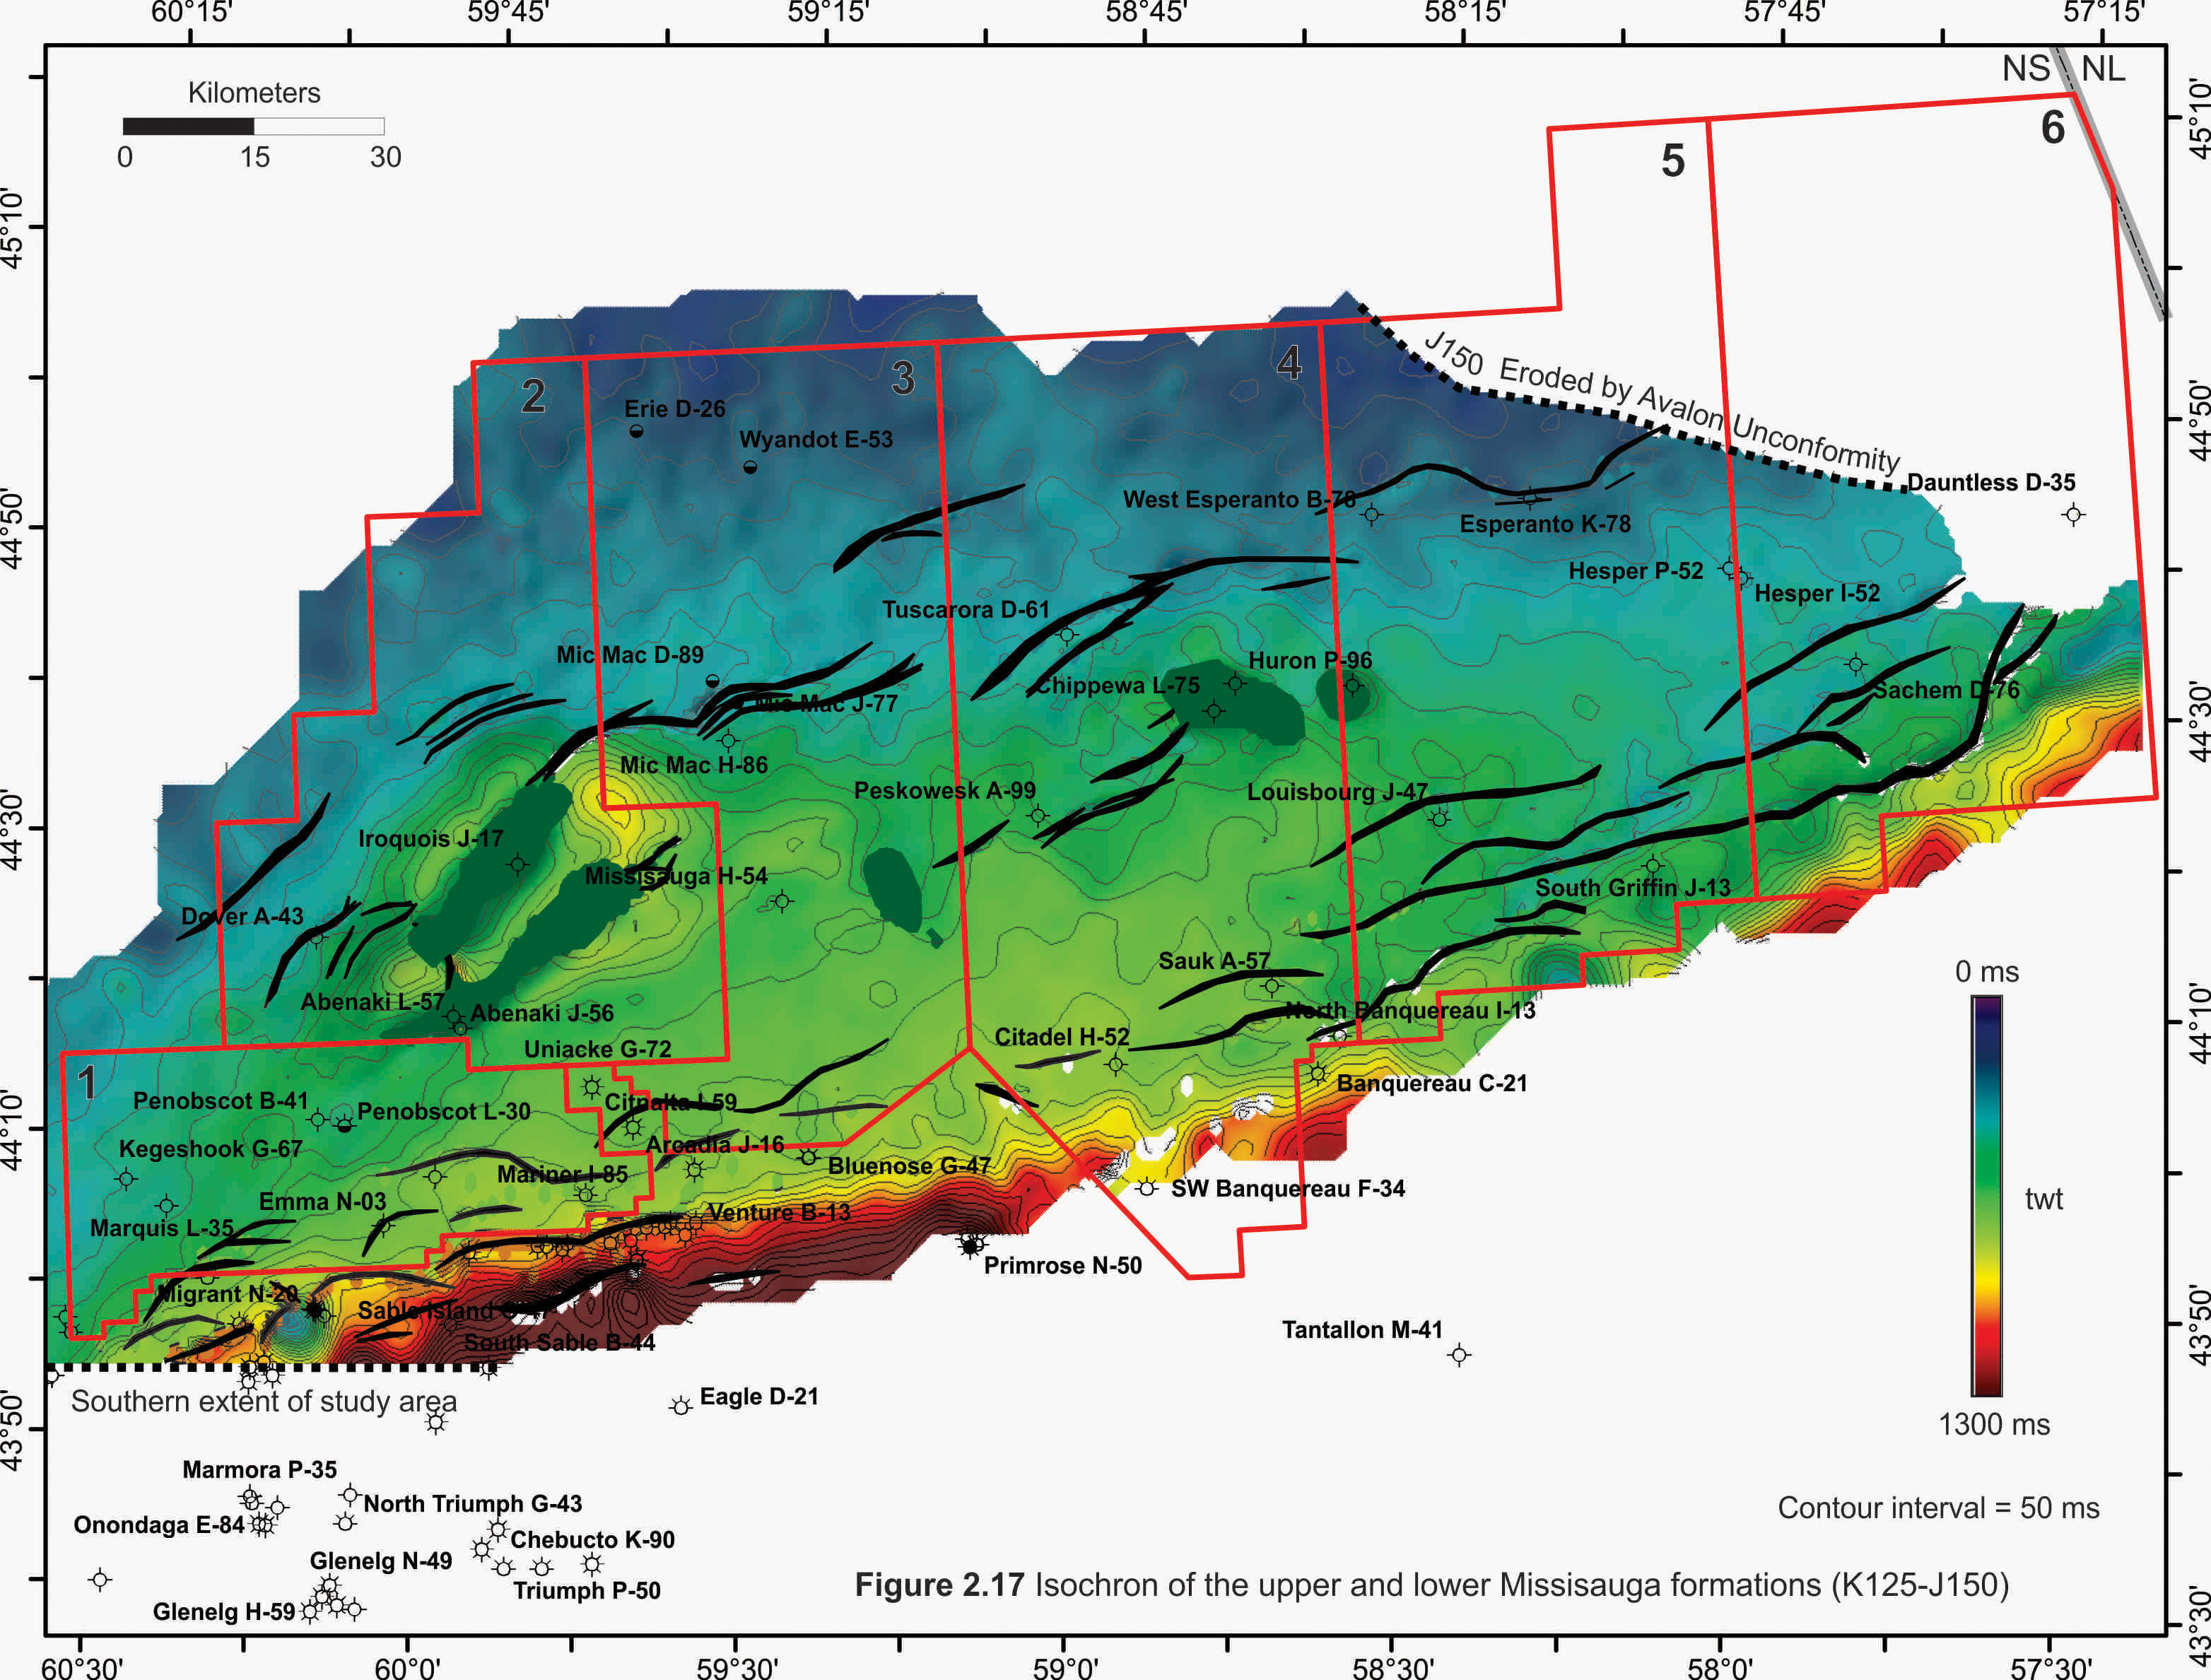
| Figure 2.17 | K125 - J150 | Missisauga Fm. Isochron |
| Figure 2.18 | K113 - K125 | Naskapi Mb. Isochron |
| Figure 2.19 | K94 - K113 | Logan and Dawson Canyon Fms. Isochron |
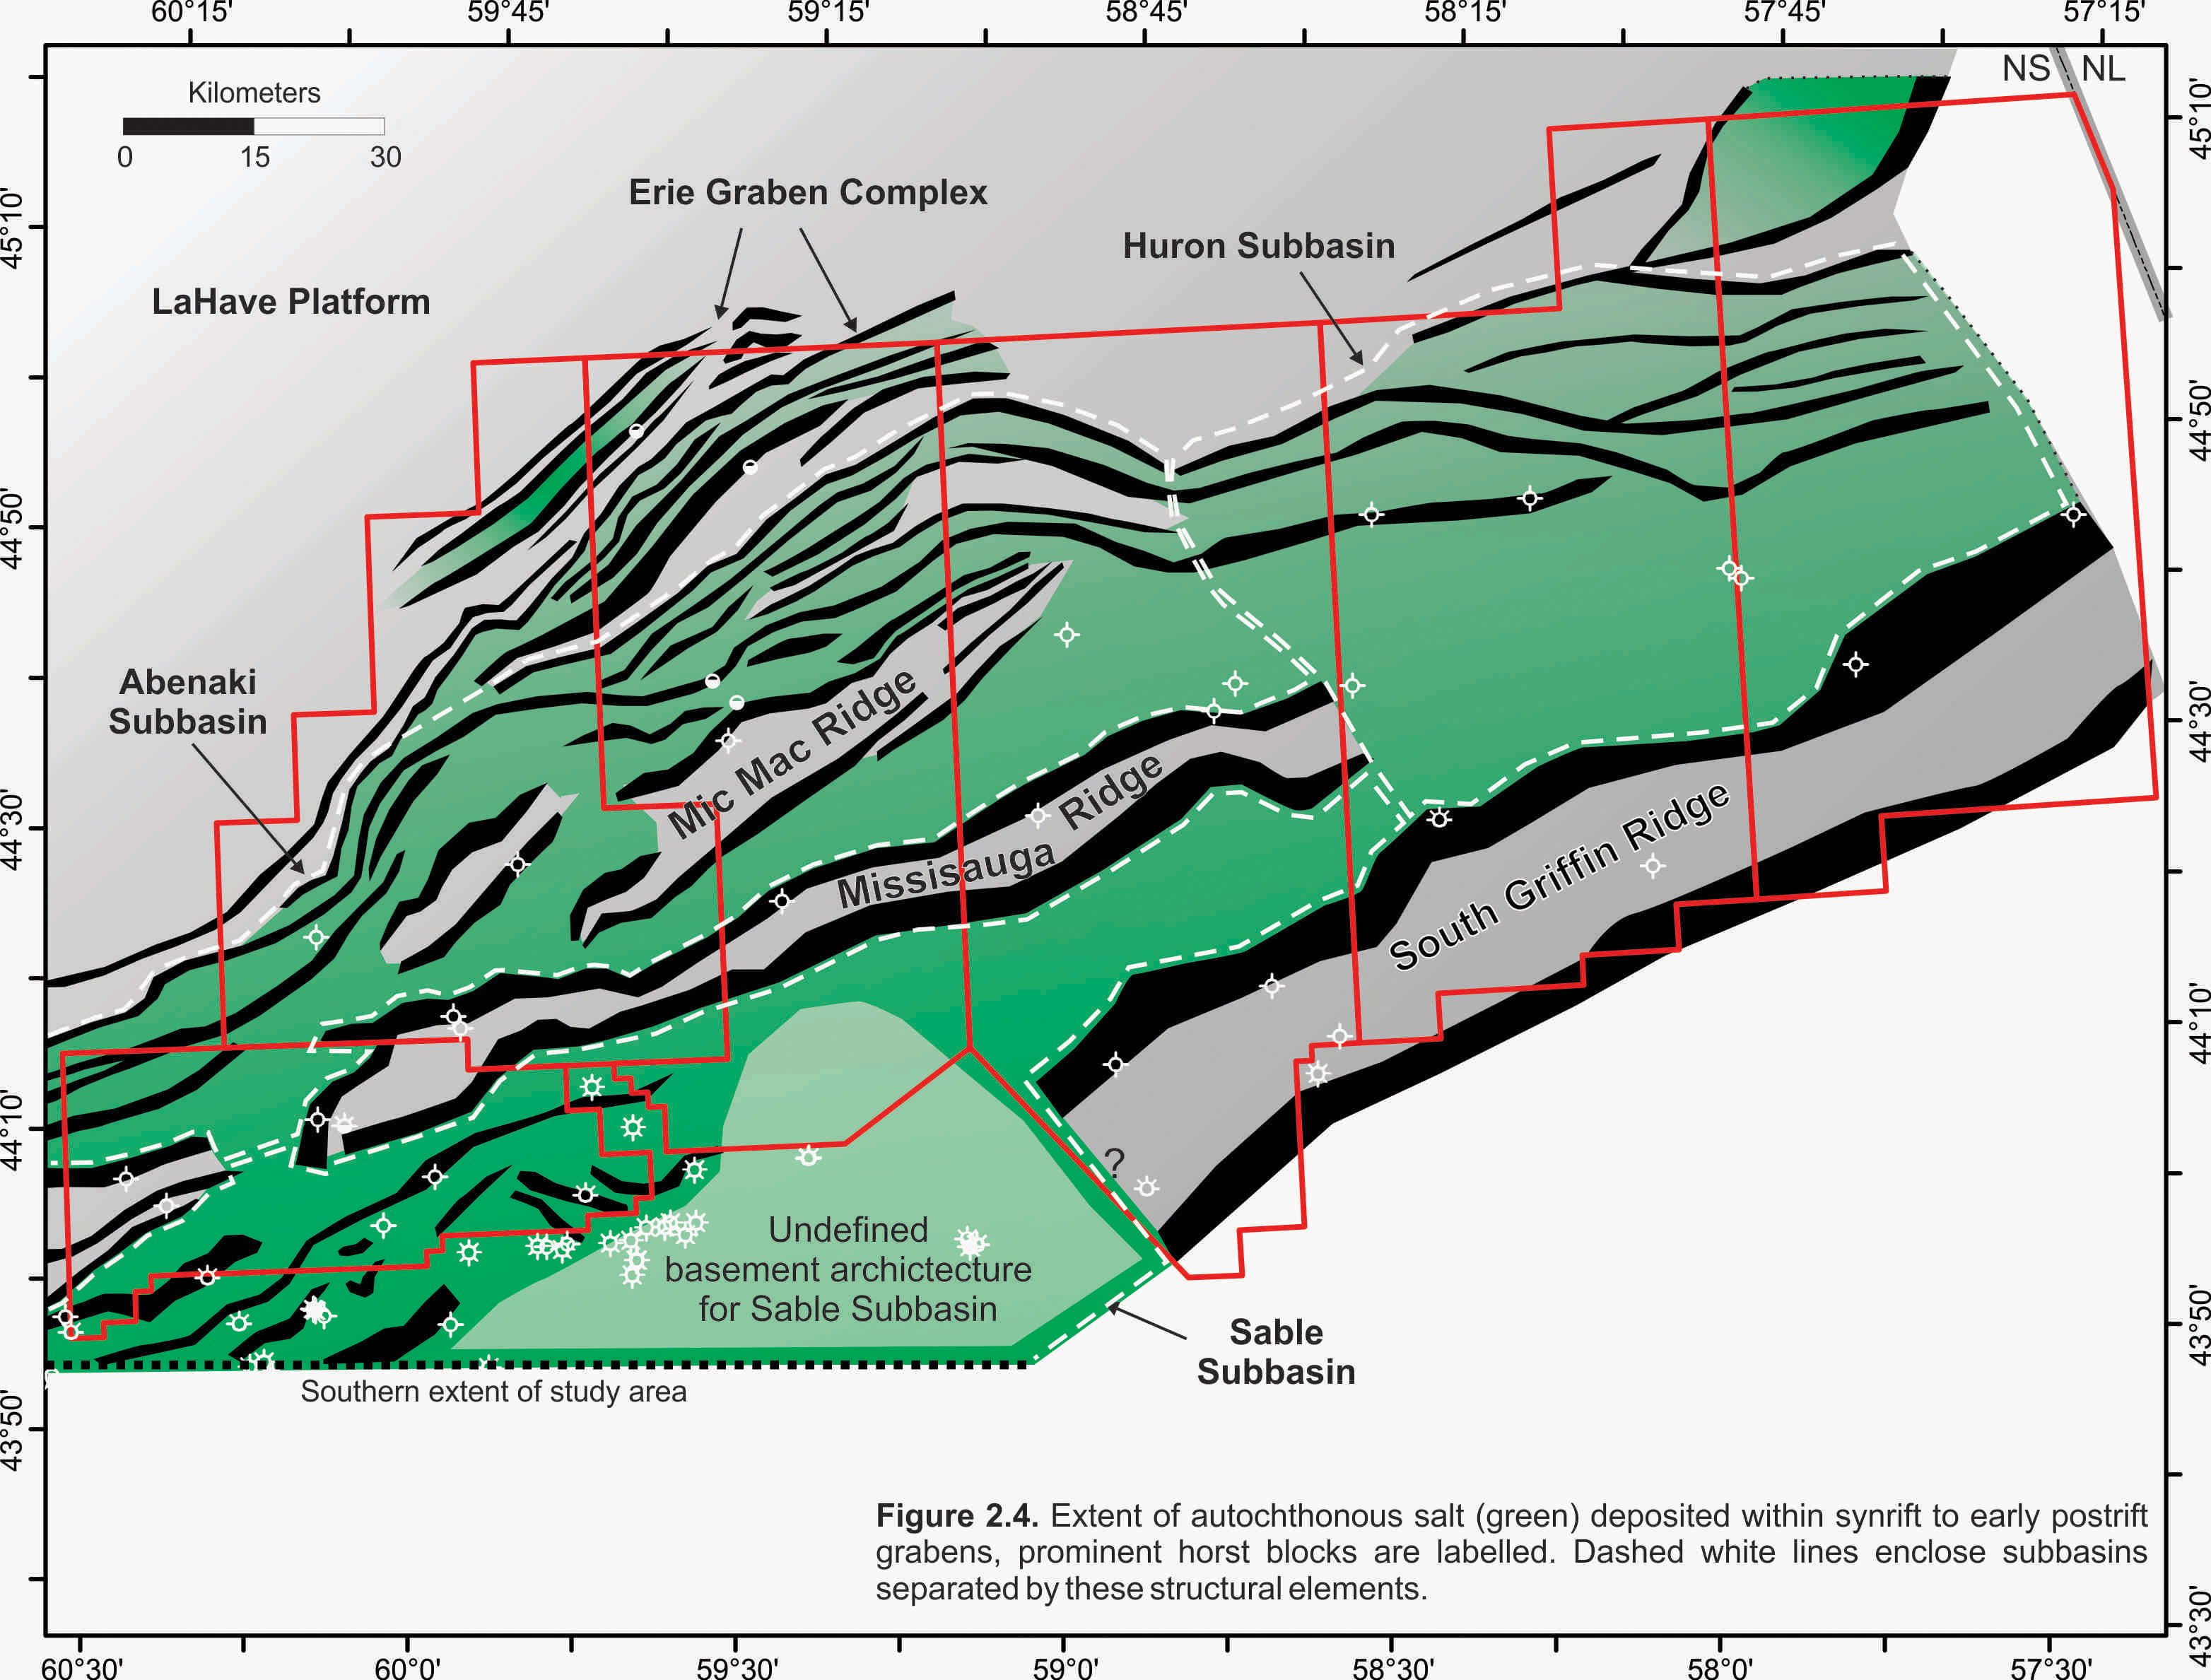
Rifting of the Scotian Margin began in the Middle Triassic and continued into the Early Jurassic forming a widespread region of horsts and grabens throughout the central and northeast Scotian Margin. A time-structure map of a time-transgressive seismic horizon interpreted to be late synrift to early postrift in age (~J200) defines the basement structure beneath the parcels (Figure 2.3). Figure 2.4 summarizes the most important basement features, which were used to refine the boundaries of known (e.g. Sable, Abenaki) and newly named (e.g. Huron) subbasins relative to Late Triassic to Middle Jurassic depocenters.
The Abenaki Subbasin is a slightly arcuate and elongate depocentre whose NE-SW axis plunges to the east and widens towards the northern half of the Huron Subbasin (Figure 2.4). It is flanked to the north by the LaHave Platform and a series of faults on the basin hinge zone herein termed the Erie Graben Complex (EGC) and is bisected by the Mic Mac Ridge. The southern boundary to the Abenaki Subbasin is the Missisauga Ridge. The term Missisauga Ridge was originally defined by Jansa and Wade (1975) and used to describe a deep, elongate salt pillow ridge associated with the basin-bounding North Sable High (Wade & MacLean 1990). In recent years Missisauga Ridge has been used variably to describe both the salt pillow and the North Sable High. Recent mapping for this Call for Bids package suggests the only the very eastern end of this “ridge”, near the Chippewa L-75 well, is a salt pillow and that the underlying North Sable High is the prominent basin bounding structure. Within this study the term Missisauga Ridge is preferred over North Sable High when describing the basin bounding structural feature (Figure 2.4).
The Huron Subbasin is a recent subdivision for the eastern extension of the Sable and Abenaki subbasins beneath the Banquereau Bank (OETR, 2011). It merges with the Laurentian Subbasin to the east, and is bounded to the south by the South Griffin Ridge. The Sable Subbasin is south of the Missisauga Ridge and has an eastern extent that extends to the northeast between the Missisauga Ridge and the South Griffin Ridge (Figure 2.4).
Autochthonous salt deposition on the Scotian Margin is interpreted to be late synrift and was bounded by basement highs in most regions. Figure 2.4 also shows the interpreted extent of autochthonous salt deposition (green polygon) and the major bounding horst blocks for the Argo Formation evaporites. Basement highs were influential in focusing the early expulsion of allochthonous salt bodies (Shimeld, 2004; Kendell, 2012). Sediment loading and downbuilding by Early Jurassic fluvial systems loaded the salt which was commonly pinned or buttressed in the basinward direction by basement highs (i.e. the Mic Mac, Missisauga and South Griffin ridges). Salt contact with these basement horsts forced the salt to climb vertically through the sedimentary section eventually forming either solitary salt diapirs or canopies. Diapirs are present in this area and noted on the structure maps at the eastern end of the Missisauga Ridge in the Huron Subbasin and off the southwestern end of the Mic Mac Ridge within the Abenaki Subbasin.
A post-rift thickness map for the Abenaki, Huron and Sable subbasins in the Play Fairway Atlas illustrates there is up to 13 km of basin-fill in Parcels 3, 4, 5 and 6 and up to 10 km of fill in Parcels 1, 2 and 3 (Plate 6-1-1a, OETR, 2011). The Early Jurassic Iroquois and Mohican formations are the initial post-rift succession in the Scotian Basin; consisting of strandplain to shallow marine carbonates (Iroquois) and coeval fluvial-dominated texturally immature siltstones, fine grained sandstones and red-brown and green shales (Mohican) (Given, 1977). Figure 2.5 is a time-structure map on the Scatarie seismic horizon (J163). This map is indicative of the structuring at the Mohican and Iroquois level throughout this region. There are a series of growths faults related to salt-withdrawal minibasins in Parcels 2 and 3 and throughout Parcels 2-6 the structure resembles that of the underlying basement. The influence of the southwest-northeast trending Missisauga Ridge is obvious in the south-central portions of Parcels 2-4 (Figure 2.5). The axis of the adjacent Huron Subbasin basin is also quite evident on the J163 structure map and trends southwest-northeast near the Tuscarora, West Esperanto and Esperanto wells. A time-thickness map from the J163 to the J200 illustrates the thickness trends of the early fill between basement highs (Figure 2.12). The distribution of grabens, half-grabens, and horst blocks, shown in figures 2.3 and 2.4, helped focus deposition during the Early Jurassic, with accommodation provided by basement extension and salt expulsion. Thick deposits of Iroquois and Mohican strata fill the deep grabens in the Abenaki and Huron subbasins. Some thickening of this sequence is also noted in the Erie Graben Complex in the northern part of Parcels 2 and 3.
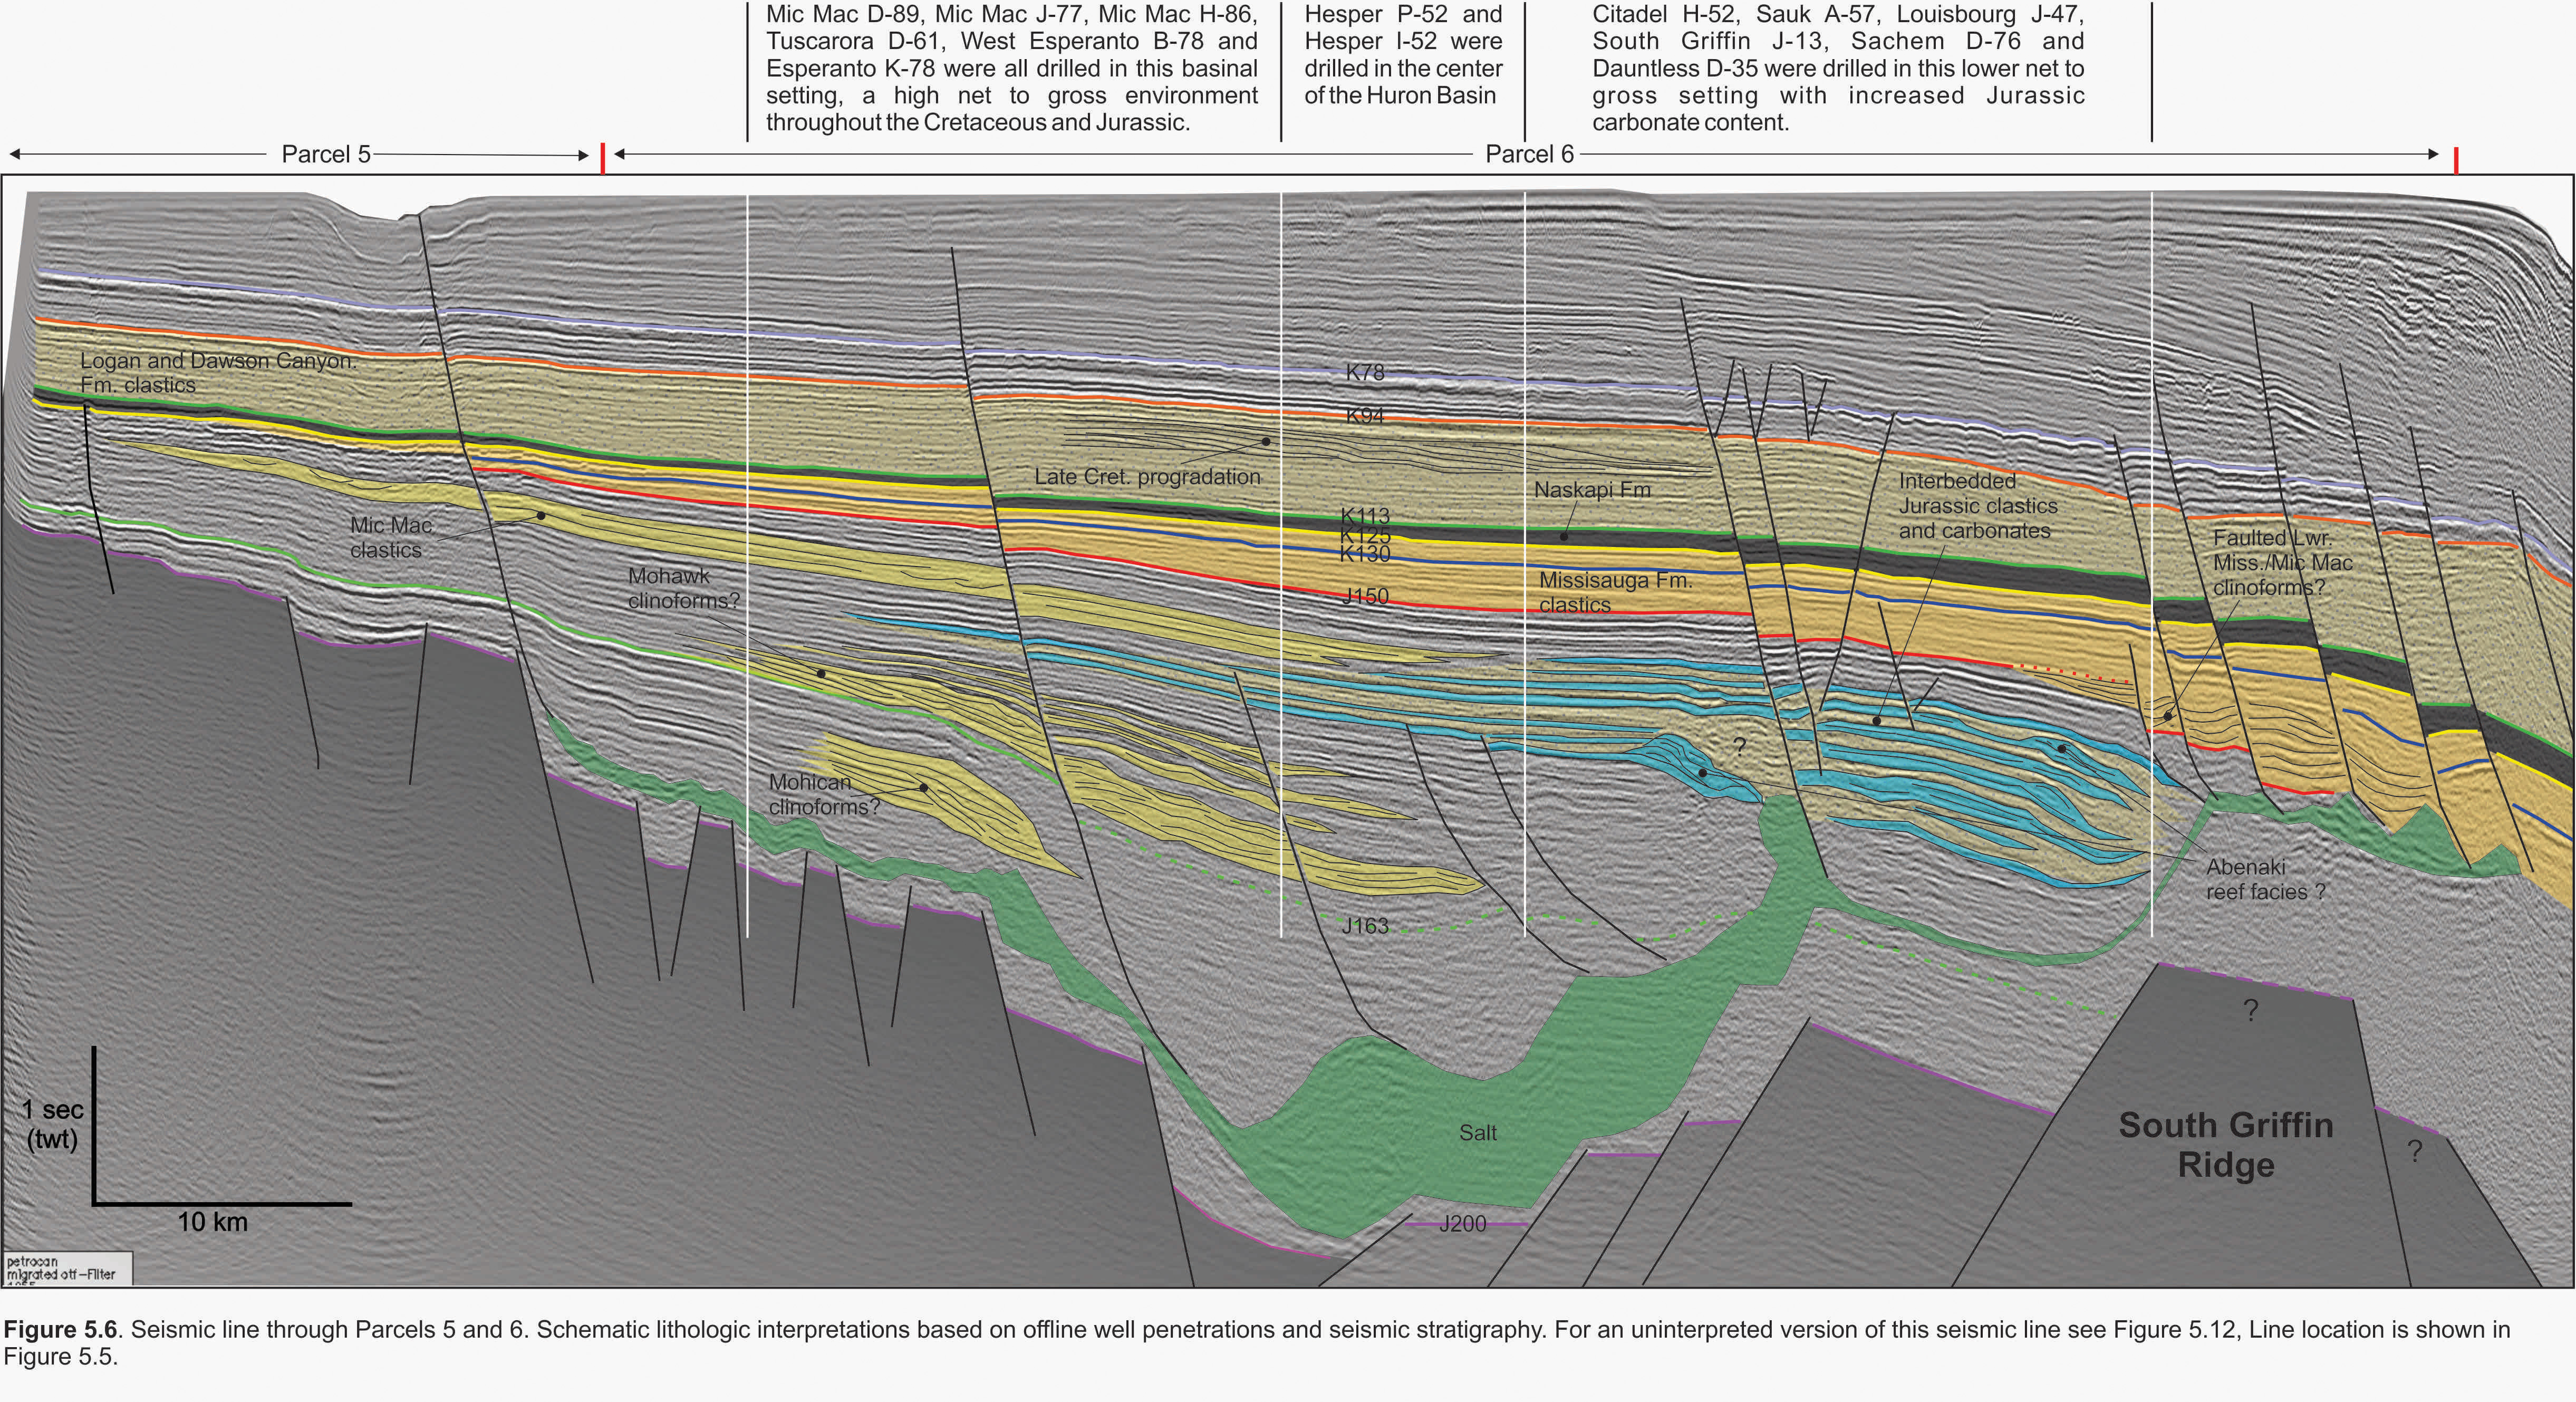
Following the deposition of the Iroquois-Mohican succession in the Middle and Late Jurassic, sedimentation was dominated by fluvial-deltaic siliciclastics of the Mic Mac Formation and coeval shallow marine to reefal carbonates of the Abenaki Formation (Wade and Maclean, 1990). Figure 2.13 is a time-thickness map of the mid/late Jurassic section (J150 to J163 representative of the thickness of both the Mic Mac and Abenaki formations). An obvious thick trends from southwest to northeast through the central and southern portion of the parcels and parallels the South Griffin Ridge. In general, this Middle to Late Jurassic section increases in carbonate content from north to south and some of this expanded thickness can be attributed to carbonate reef and ramp development of the Abenaki Formation. For example, Mic Mac clastics are present in the Mic Mac J-77, Mic Mac D-89, Peskowesk A-99, Tuscarora D-61, West Esperanto B-78 and Esperanto K-78 wells and have good porosities (e.g. ~19-22% at Esperanto K-78 and up to 22% at West Esperanto B-78). Moving to the south towards the South Griffin Ridge, wells penetrating this interval show that the carbonate content increases (Figure 5.6). At Louisbourg J-47 the Mic Mac Formation is carbonate-rich with many tight, thick limestones. The thin Mic Mac sands that are present here also tend to have lower porosities than in the wells in the northern part of the parcels. However, the Mic Mac is still a potential reservoir interval in this area. An overpressured, 12.5 m Mic Mac gas sand at Louisbourg J-47 was tested at an estimated rate of 5.0 MMscf/d. Mechanical difficulties during the test prevented the well from flowing at higher rates. It was estimated, that had the test been successful the sand had the potential to flow at rates of up to 28 MMscf/d. Thick deposits of this J150-J163 sequence are also present surrounding the salt diapirs in Parcel 2.
The Missisauga Formation was deposited throughout the Early Cretaceous. This sand rich sequence of fluvial-deltaics to shallow marine sediments can be divided into upper and lower members that are separated by the O Marker, an interval of generally thin Hauterivian/Barremian oolitic limestones, (Figure 5.6). A time-structure map on this horizon (K130) is representative of the structuring throughout this region at multiple horizons (Figure 2.7). Listric faults are common along the basin hinge zone that trends southwest-northeast through the central and/northern parts of the parcels. This trend of faults related to the underlying basin hinge zone formed the rollover anticlines drilled at Mic Mac J-77, Tuscarora D-61, West Esperanto B-78 and Esperanto K-78. Structural lows are present north of the Missisauga Ridge and strata throughout the Late Jurassic and Cretaceous are folded across this basement horst block (Figures 2.5 - 2.11). Another series of faults is present in the southern parts of the parcels. These faults offset strata down to the top of the South Griffin Ridge and often detach in salt expelled from the Huron Subbasin that veneers this ridge in several locations. These two fault trends are visible on most structure maps and are likely a result of two different processes: 1) differential compaction and folding across the underlying horst and grabens and 2) detachments into both autochthonous and allochthonous salt bodies.
Figures 2.15 and 2.16 are isochrons of the lower (K130 to J150) and upper Missisauga (K125 to K130), members respectively. There is a southwesterly shift of the deltaic deposits relative to the previous Jurassic isochrons. The southern portions of Parcels 1-5 have thick Cretaceous deposits and these thicken further south of the call parcels into the Sable Subbasin. The Missisauga has excellent reservoir properties and two thin oil zones were encountered in thick upper Missisauga sands in the Mic Mac J-77 well (Figure 2.16). One 62 m sand has 2.0 m of oil pay with net pay porosity of 32% and a deeper 41 m sand has 1.0 m of oil pay with net pay porosity of 34%. This is a very high net to gross interval and although the reservoir quality of these sands is very good to excellent, an adequately thick seal is required in order to produce a large oil column.
An Early Cretaceous potential regional seal within the Abenaki and Huron subbasins is the transgressive MFS Naskapi shale. A time-thickness map of the Naskapi shale (K113 to K125) is shown in Figure 2.18. Where sufficiently thick, the Naskapi can be an effective sealing horizon for the underlying upper Missisauga Formation. This thickness is attained in the Sable Subbasin where the Naskapi is the seal for a number of upper Missisauga Significant Discoveries. The isochron in Figure 2.18 illustrates that the Naskapi is relatively thin throughout the northern half of Parcels 2-6. Depending on fault throw and play type, it may not always be a reliable seal in this area. It’s thickness increases across the listric growth faults in the southern half of blocks 1-6 where it may provide an adequate seal (Figure 5.6). Although thin, the Naskapi shale is providing some seal at the Mic Mac J-77 well in Parcel 3, where thin oil columns were encountered.
A final isochron map of the K94 to K113 interval is representative of the time-thickness of the Late Cretaceous Dawson and Logan Canyon formations (Figure 2.19). The Logan Canyon comprises alternating shale and sandstone successions that are interpreted to have been deposited in a broad coastal plain and shallow shelf environment (Wade and Maclean 1990). This map shows a depositional thick trend across the central part of the parcels from southwest to northeast. The thickest parts of this interval are within Parcels 2, 3 and 4 and the interval thickens to the south towards the Sable Subbasin. These units are a potential reservoir interval and several thin oil zones were encountered in this sequence within Parcel 3 in the Mic Mac D-89 well. Here, three reservoir sands were encountered that ranged in thickness from 4-19 m. Each of these sands had between 1 to 3 m of oil pay and average net pay porosities of up to 30%.


