Potential Traps and Reservoirs
There are proven oil reserves at Penobscot L-30 above the Missisauga Ridge and oil pay at Mic Mac J-77 and D-89 above the Mic Mac Ridge. Both of these ridges cross Parcels 1, 2 and 3 (Figure 2.3). On Parcel 1 there is also gas pay in Mariner I-85 and Emma N-03. An active petroleum system has been confirmed although its age is uncertain.
Good potential exists for Cretaceous and Jurassic clastic reservoir sand on all six blocks. High quality sands have been identified at most intervals penetrated. The majority of wells drilled on salt structures were located using 1970’s vintage 2D seismic data with a few from the 1980’s, which results in very poor imaging of traps, but good potential can be expected where salt diapirs have enhanced hydrocarbon migration from deeper (Early-Middle Jurassic) source rock successions. Good quality 3D seismic data would help to identify traps involving the numerous salt structures.
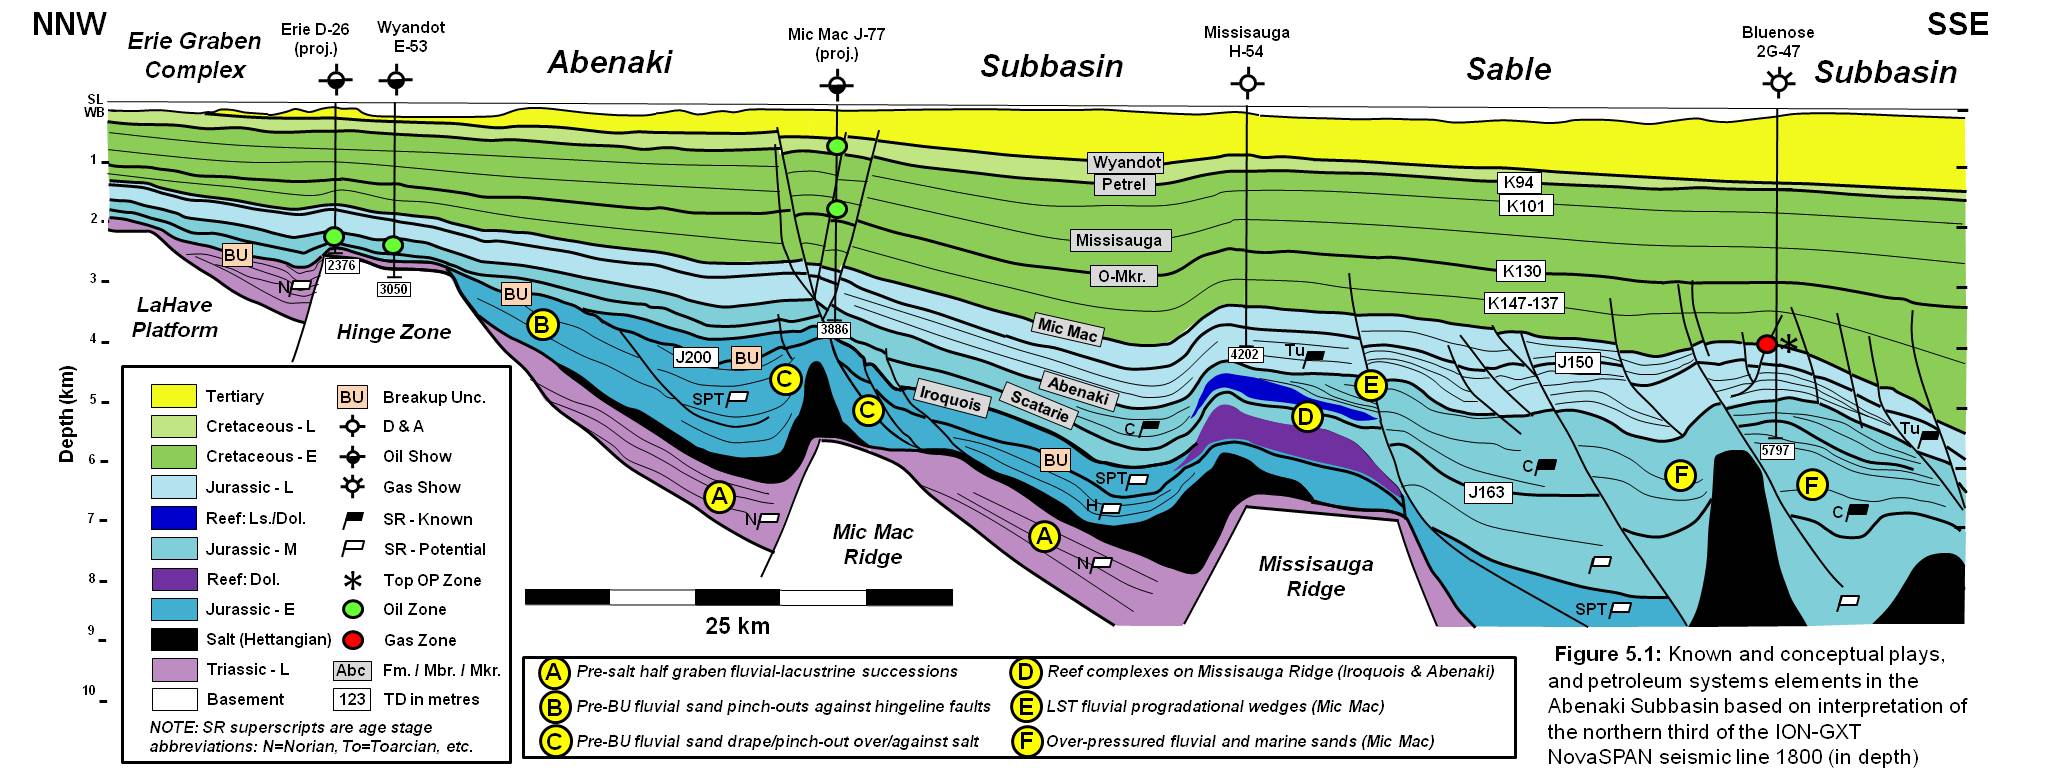
There is also potential development of transgressive system tract, Early Jurassic Iroquois, Middle Jurassic Scatarie, and Late Jurassic Abenaki formations bioherms along the basin hinge zone during periods of rising sea level or flooding. There are indications of a stacked, Abenaki reefs in Parcel 4 as noted below. This could be similar to the Deep Panuke gas field hydrothermal dolomitic and leached limestone reservoir, but older (lower Baccaro Member, Abenaki A2-A4). Faulted basement ridges in other locations may also facilitate development of aggradational reef complexes in other parcels.
Figure 5.1 illustrates known and conceptual plays in the Call for Bids region along with the petroleum systems elements.
Parcel 1
Penobscot Oil Discovery
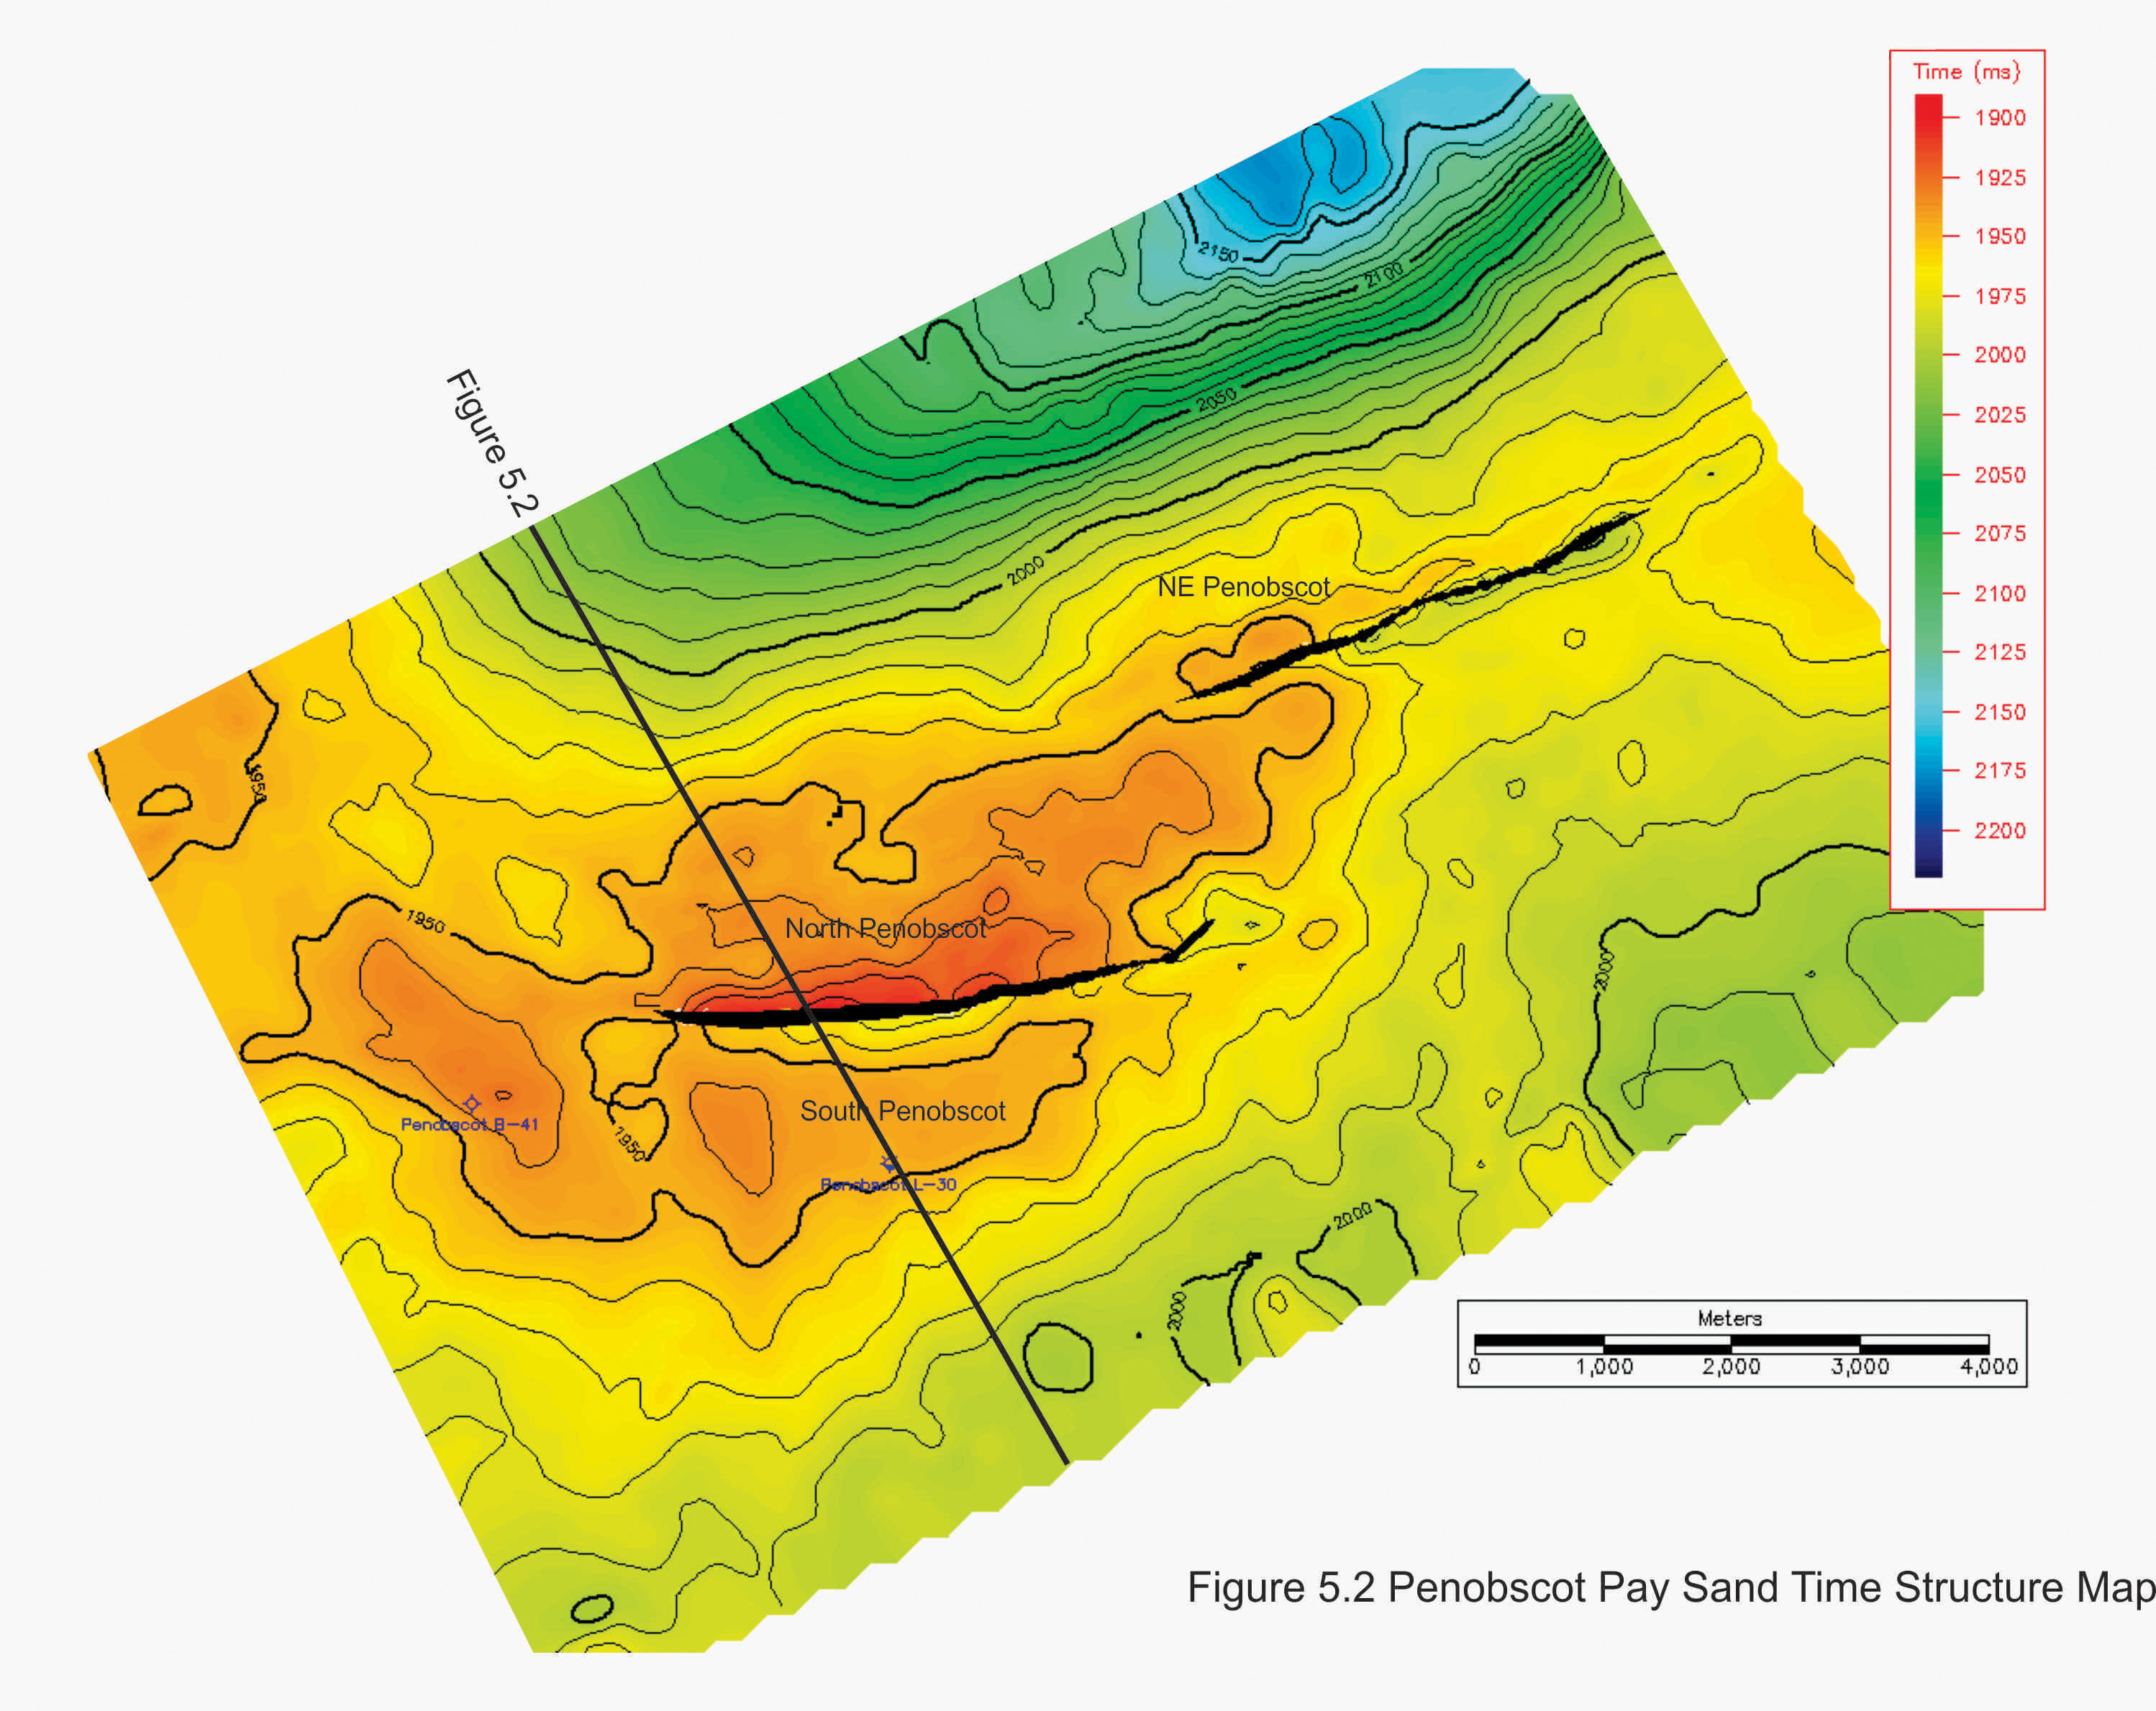
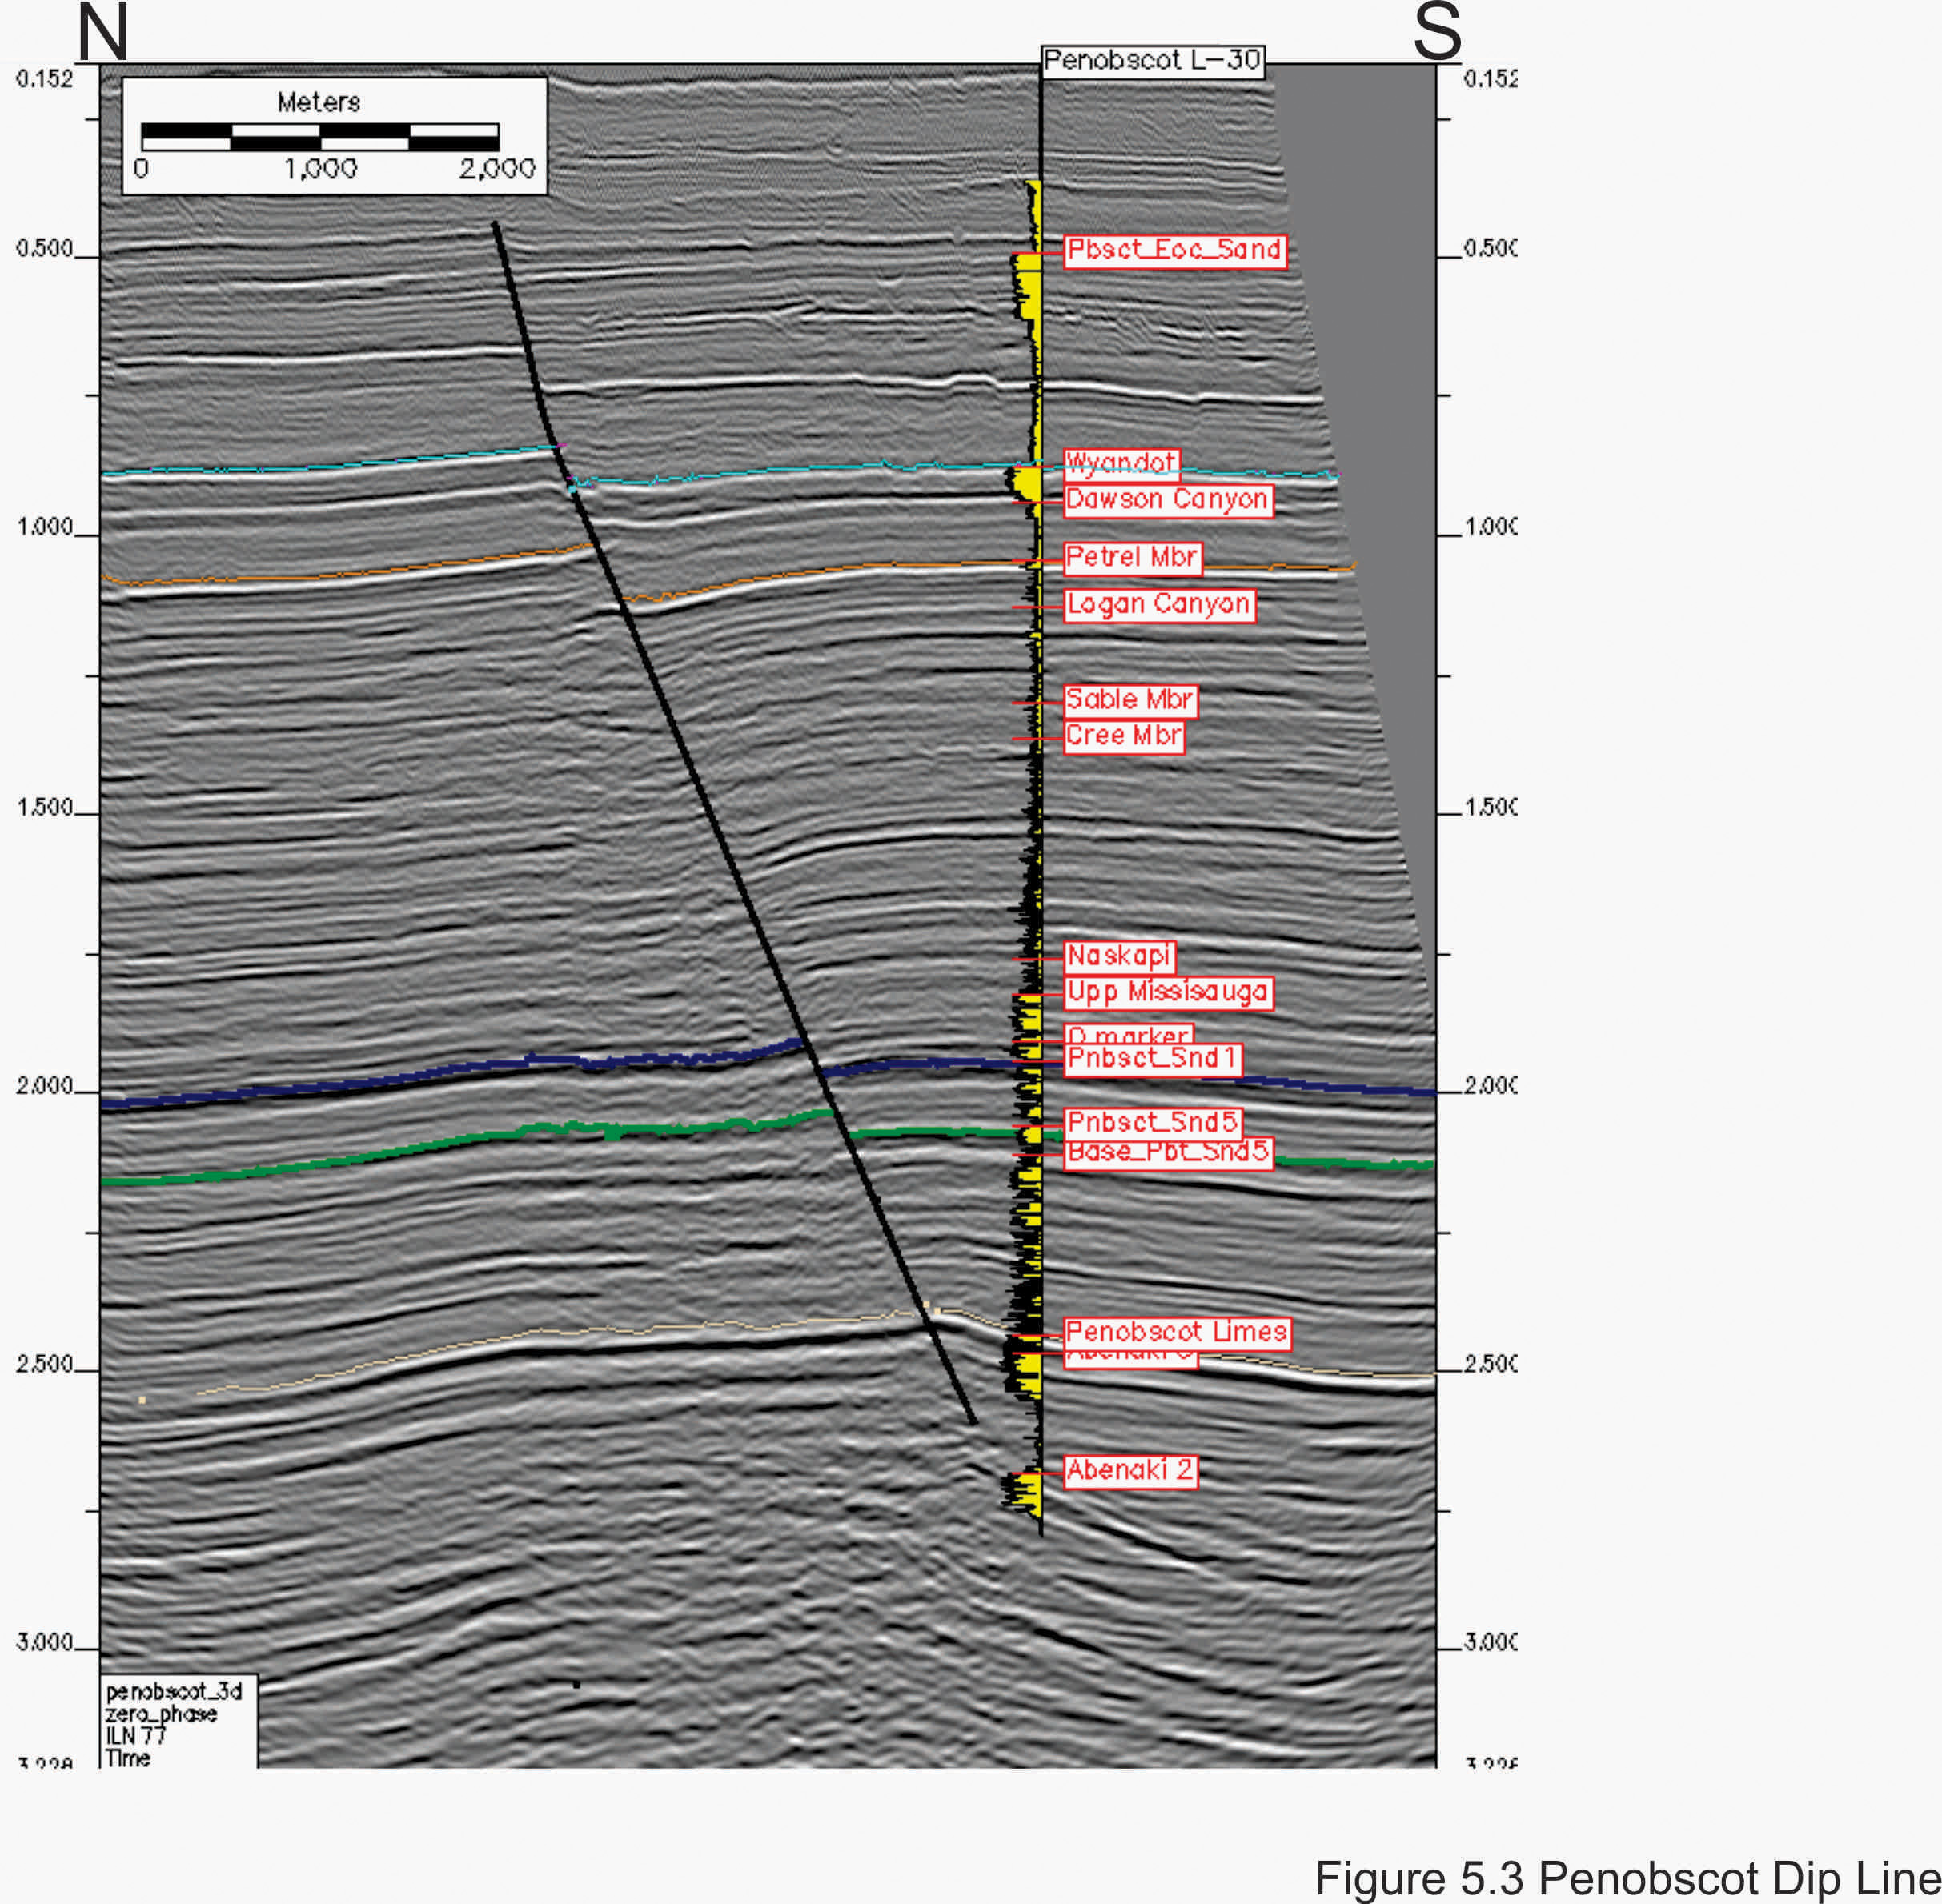
The Penobscot field is located 30 km northeast of the Thebaud production platform in water depths ranging from 50 to 200 m. The initial well on the structure, Penobscot L-30, was drilled by Petro-Canada-Shell in 1976 to a depth of 4237.5 m in 138 m of water. Figure 5.2 show a time structure map on blue Sand 1 marker, indicated on the dip line through the L-30 well location (Figure 5.3). Hydrocarbons were recovered by Repeat Formation Tester (RFT) from four Middle Mississauga sands on the down thrown side of the fault.
A second well, Penobscot B-41, was drilled by Shell-Petro Canada in 1977. This well is 3 km to the northwest and at the time was believed to be up-dip of L-30, on the same structure. The B-41 well reached a total depth of 3414 m in 118 m of water. No significant hydrocarbons shows were encountered and no formation tests were run. The stratigraphic tops in B-41 were within 10 m of the tops in the L-30 well suggesting that B-41 was not substantially up-dip of L-30. Recent seismic reprocessing and depth conversion demonstrate that B-41 may have been drilled into a separate closure. The closure to the north of the fault has not been drilled.
After the licence was relinquished by Shell, Nova Scotia Resource Limited (NSRL) obtained an Exploration Licence over the Penobscot prospect in 1989 and acquired 66 km2 of 3D seismic (CNSOPB program number NS24-N011-001E). The interpretation report for this survey, completed in 1991, including synthetics, depth conversions and maps, is available through the Geophysical Data section under the Data tab. A second report completed in 1992 that included further mapping and reserve estimates is also available. This report identified additional potential northeast of the original mapped Penobscot prospect that has yet to be tested.
The Penobscot 3D seismic data is now owned by the Province of Nova Scotia who has made the digital SEGY data available free to the public through the CNSOPB’s Geoscience Research Center (GRC). The Provincial Government also reprocessed this 3D seismic to improve data quality. Instructions for downloading both of these data sets can be found in the Digital Data section.
Penobscot L-30 and B-41A Petrophysical Assessment
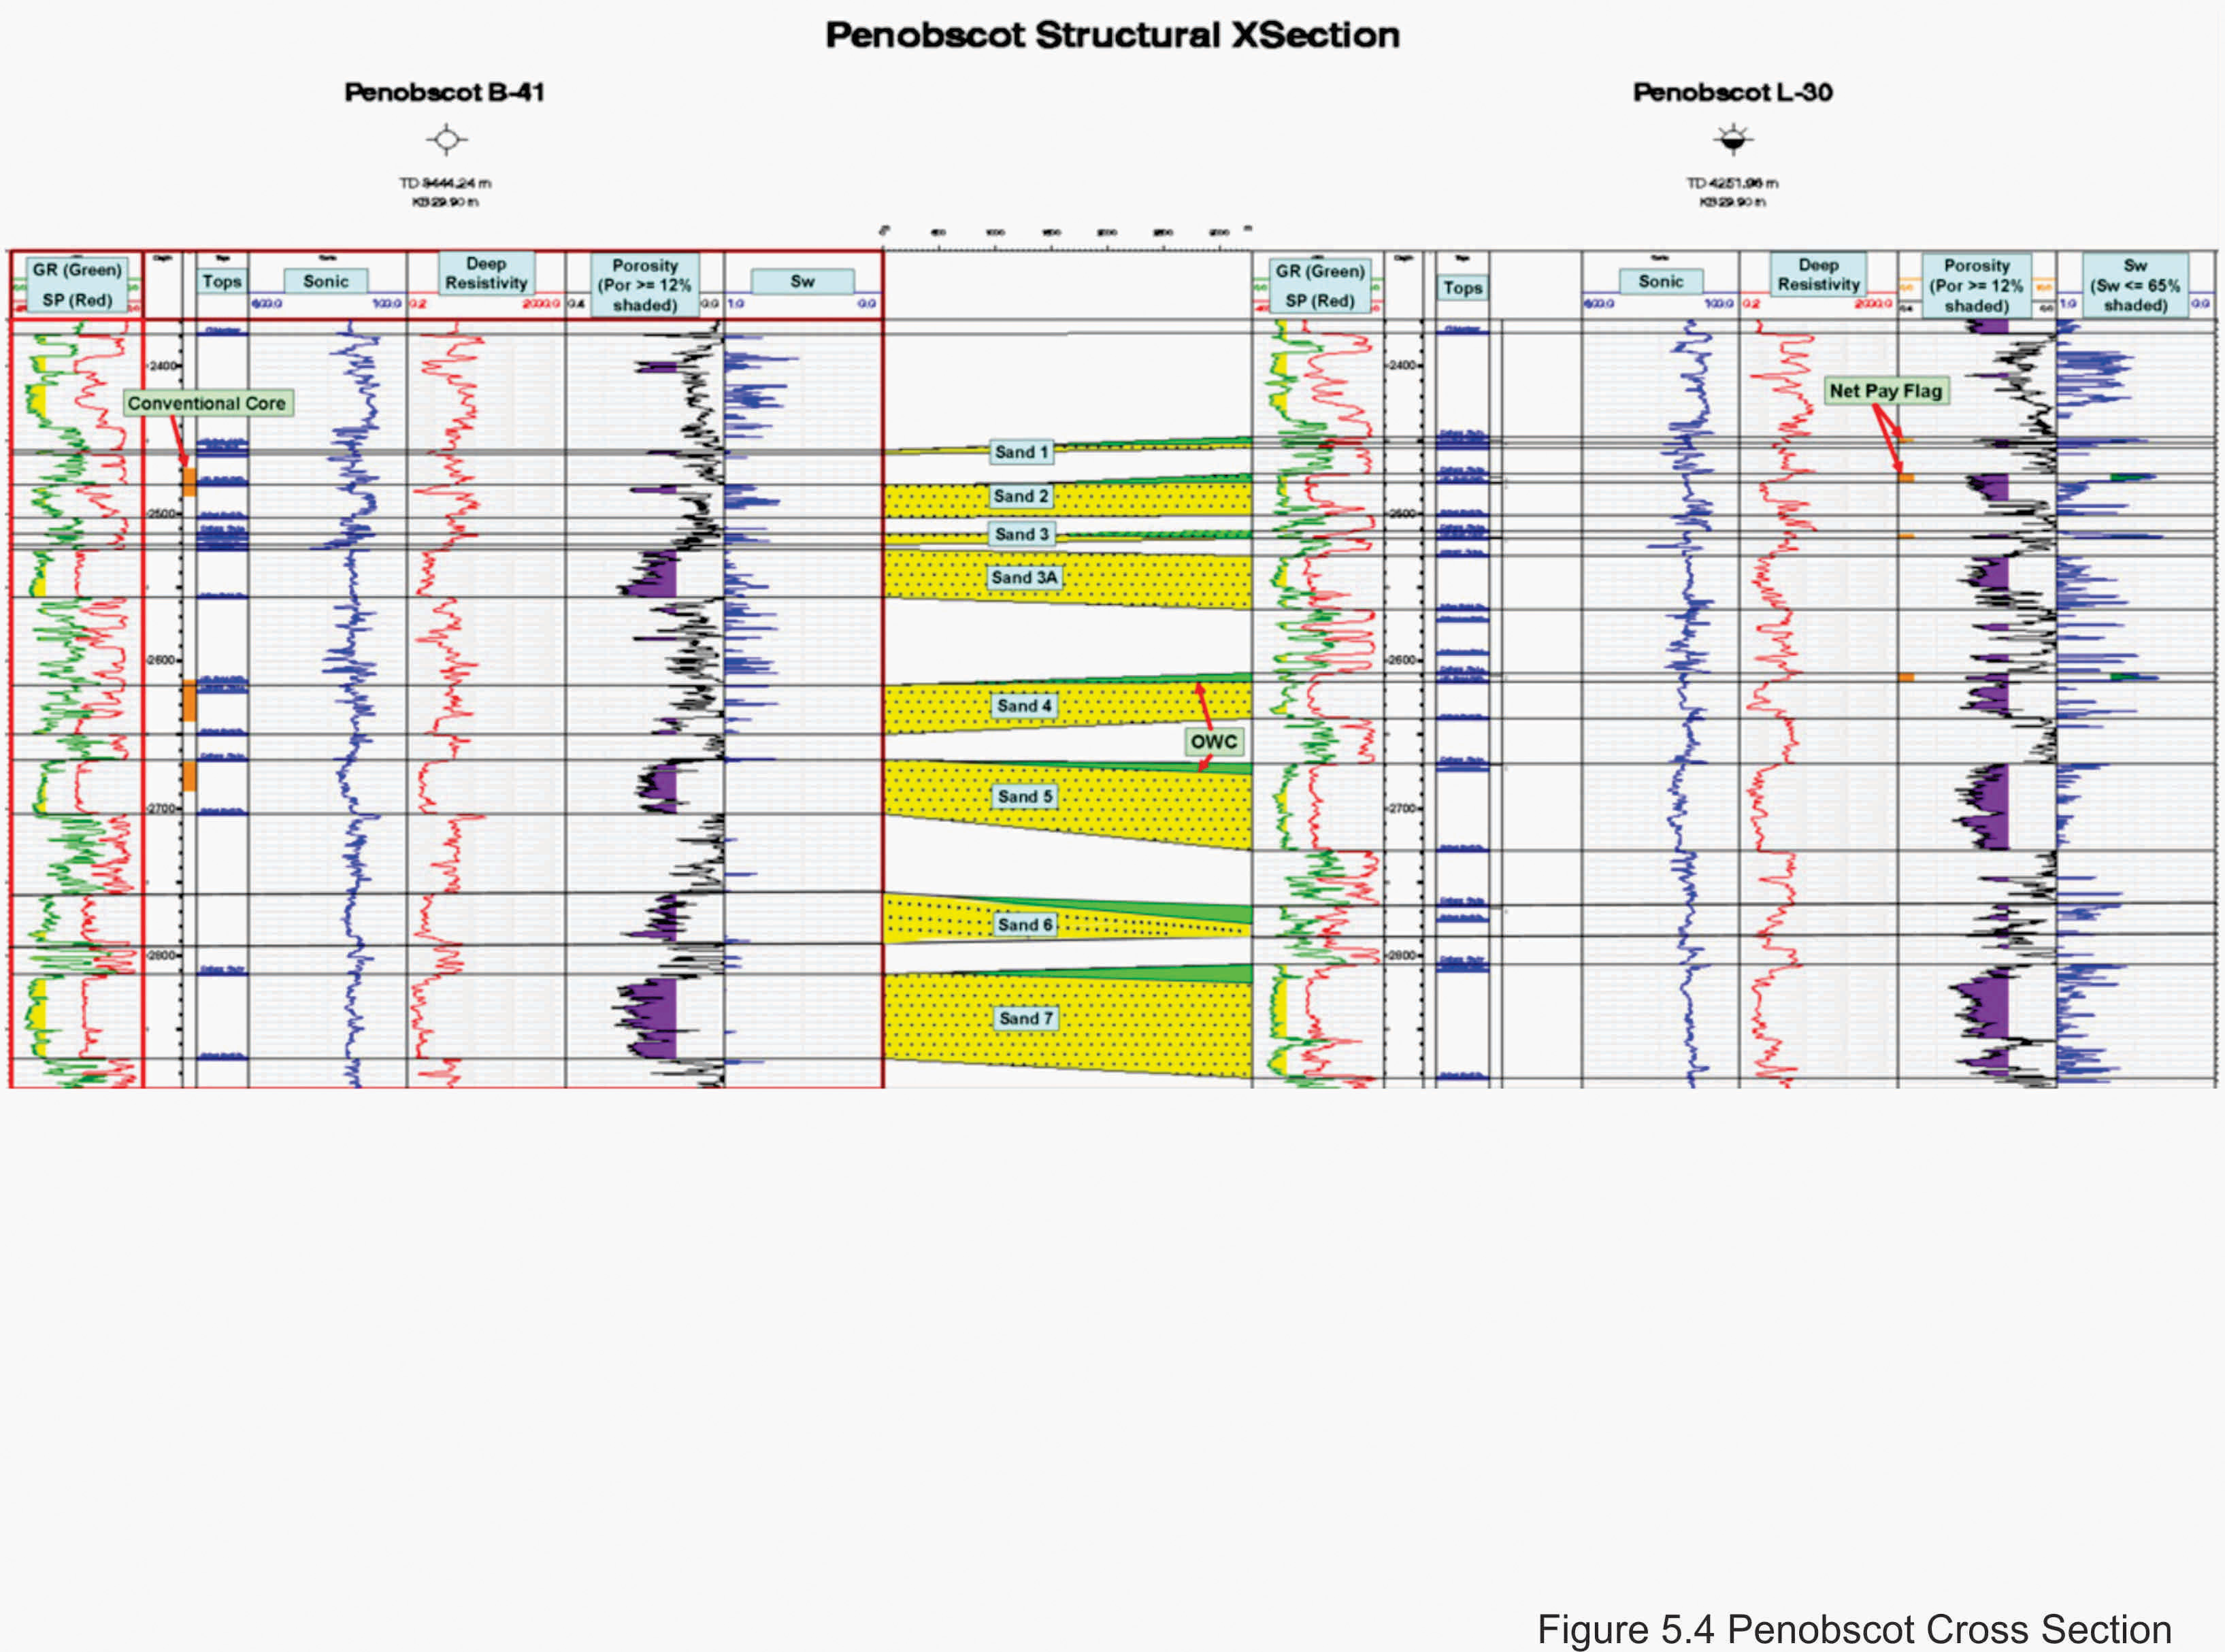
A complete suite of the primary logs were acquired in both Penobscot L-30 and Penobscot B-41. Two conventional cores were cut in L-30, however both cores were cut well below the reservoir interval. In B-41 four conventional cores were cut within the Penobscot reservoir interval, (Figure 5.4). The Penobscot B-41 core intervals are listed below.
|
Core# |
Interval (m MD) |
Recovery |
|
Core# 1 |
2499.4 – 2517.6m |
Rec. 17.4m |
|
Core# 2 |
2642.6 – 2660.9m |
Rec. 14.3m |
|
Core# 3 |
2660.9 – 2670.0m |
Rec. 8.2m |
|
Core# 4 |
2699.0 – 2717.9m |
Rec. 3.05m |
Routine core analysis was conducted on the above cores. Average core porosity of the reservoir interval is 20%, with a maximum of 32%. Average permeability of the reservoir interval is 120 mD with a maximum of over 1000 mD.
No Drill Stem Tests (DSTs) were conducted in either Penobscot L-30 or B-41, however a number of Repeat Formation Tests (RFTs) were run in L-30. The RFT fluid recoveries, from the Penobscot L-30 reservoir sands, are listed below.
|
Penobscot L-30 – Fluids Recovered from RFT (Sands 1 - 5 Only) |
|||||
|
Sand# |
Depth (m) |
Oil/Condensate (cc) |
Gas (cu ft) |
Water (cc) |
Remarks |
|
1 |
2480.2 |
3400 cc cond. |
1.0 |
nil |
|
|
2 |
2504.8 |
900 cc oil |
Nil |
8,000 |
|
|
2 |
2509.4 |
nil |
Nil |
10,250 |
Sample taken below |
|
2 |
2509.4 |
nil |
Nil |
3,750 |
Sample taken below |
|
3 |
2545.4 |
100 cc oil |
0.5 |
10,000 |
<1 m above OWC1 |
|
4 |
2639.3 |
3,800 cc cond. |
10.0 |
5,2002 |
|
|
4 |
2639.3 |
3,000 cc cond. |
5.0 |
Nil |
|
|
5 |
2700.5 |
nil |
Nil |
10,250 |
Transition zone3 |
|
5 |
2700.5 |
nil |
Nil |
3,750 |
Transition zone3 |
|
5 |
2700.8 |
nil |
Nil |
9,700 |
Transition zone3 |
1. This RFT recovered mainly water due to the proximity of the oil-water contact (OWC), i.e. RFT taken <1 m above OWC.
2. Both RFTs run at this depth recovered considerable condensate and gas. The water recovered from this RFT is likely mud filtrate and not formation water.
3. These RFTs were taken only 2 m above the interpreted OWC in sand 5. The upper portion of sand 5, at the L-30 location, is within the transition zone and has a high water saturation (Sw ~70%) resulting in water recovery on RFT.
Seven normally pressured hydrocarbon bearing sands were encountered in Penobscot L-30 within the Lower Missisauga formation. As indicated by the RFT fluid recoveries, most sands appear to contain light oil/condensate and gas. It is unclear if the gas recovered from RFT is solution gas or free gas. Based on a petrophysical assessment of the zones it appears that light oil/condensate is the primary reservoir fluid.
A petrophysical assessment of the Penobscot L-30 and B-41 was conducted using available log, core and RFT data (Figure 5.4). The Penobscot reservoir sands are wet in Penobscot B-41, however seven hydrocarbon bearing zones were encountered in Penobscot L-30. Each sand in L-30, was interpreted to have a separate log defined oil-water contact. The results of the Penobscot L-30 petrophysical assessment are summarized below.
|
Penobscot L-30 – Reservoir Properties |
|||||
|
Sand |
Top (m MD) |
Base (m MD) |
Net Pay (m TVD) |
Net Pay Por. (%) |
Sw (%) |
|
1 |
2477.6 |
2484.9 |
1.2 |
19 |
49 |
|
2 |
2503.0 |
2530.9 |
4.6 |
21 |
46 |
|
3 |
2542.0 |
2546.6 |
2.1 |
18 |
41 |
|
3A |
2558.5 |
2594.6 |
Wet |
N/A |
N/A |
|
4 |
2638.0 |
2669.0 |
4.3 |
19 |
45 |
|
5* |
2699.2 |
2758.5 |
<0.5 |
N/A |
N/A |
|
6* |
2795.5 |
2805.4 |
<0.5 |
N/A |
N/A |
|
7* |
2835.3 |
2912.8 |
<0.5 |
N/A |
N/A |
* Penobscot L-30 was drilled on the flank of the South Penobscot structure and thus encountered relatively thin oil columns at the L-30 location. There is approximately 15 m of additional structural relief, for each of the Penobscot sands, updip of L-30. Sands 5 -7 have interpreted oil-water contacts within a few metres of the top of each sand. As a result, the top portion of these sands is transitional and has high water saturation (~70%). Sands 5 – 7 appear to have very thin (<0.5 m) oil pay over water at the very top of the each sand which supports the interpretation that the sands are transitional at the L-30 location.
Penobscot Reserve Estimates
The Penobscot field is directly analogous to the Cohasset/Panuke oil fields located on the Scotian Shelf approximately 60 km to the southwest. Combined, Cohasset and Panuke produced 44.5 MMBbls of light sweet oil from high quality, relatively thin, reservoir sands located within the Logan Canyon and upper Missisauga formations. The fields were on production from 1992 – 1999. The total volume of oil produced from Cohasset was 28.3 MMBbls and total Panuke production was 16.2 MMBbls. This demonstrates that relatively modest offshore oil fields can be economically viable.
Penobscot is interpreted to contain three separate oil accumulations (Figure 5.2)
- South Penobscot L-30 well area,
- North Penobscot North of the main fault,
- Northeast Penobscot North of the second fault to the NE.
South Penobscot contains high confidence oil reserves. North & Northeast Penobscot have not been tested by drilling and therefore contain lower confidence (possible) reserves. Due to the different confidence levels, between the northern and southern areas of the field, each region was assessed separately. The CNSOPB conducted a probabilistic resource assessment of these two regions, South Penobscot (proven reserves) and North/Northeast Penobscot (possible reserves), and the results are tabulated below.
|
South Penobscot - Original Oil in Place |
|||
|
P90 (E6M3) |
P50 (E6M3) |
P10 (E6M3) |
Mean (E6M3) |
|
6.2 |
10.3 |
14.5 |
10.4 |
|
|
|||
|
P90 (MMBbls) |
P50 (MMBbls) |
P10 (MMBbls) |
Mean (MMBbls) |
|
39.3 |
64.9 |
91.3 |
65.3 |
|
|
|||
|
North & Northeast Penobscot - Original Oil in Place |
|||
|
P90 (E6M3) |
P50 (E6M3) |
P10 (E6M3) |
Mean (E6M3) |
|
6.0 |
12.4 |
21.3 |
13.1 |
|
|
|||
|
P90 (MMBbls) |
P50 (MMBbls) |
P10 (MMBbls) |
Mean (MMBbls) |
|
37.7 |
77.9 |
134.1 |
82.4 |
|
|
|||
|
Total Penobscot - Original Oil in Place |
|||
|
P90 (E6M3) |
P50 (E6M3) |
P10 (E6M3) |
Mean (E6M3) |
|
12.2 |
22.7 |
35.8 |
23.5 |
|
|
|||
|
P90 (MMBbls) |
P50 (MMBbls) |
P10 (MMBbls) |
Mean (MMBbls) |
|
77.0 |
142.8 |
225.4 |
147.7 |
|
South Penobscot - Recoverable Oil in Place |
|||
|
P90 (E6M3) |
P50 (E6M3) |
P10 (E6M3) |
Mean (E6M3) |
|
2.1 |
3.6 |
5.2 |
3.6 |
|
|
|||
|
P90 (MMBbls) |
P50 (MMBbls) |
P10 (MMBbls) |
Mean (MMBbls) |
|
13.4 |
22.4 |
32.8 |
22.8 |
|
|
|||
|
North & Northeast Penobscot - Recoverable Oil in Place |
|||
|
P90 (E6M3) |
P50 (E6M3) |
P10 (E6M3) |
Mean (E6M3) |
|
2.1 |
4.3 |
7.6 |
4.6 |
|
|
|||
|
P90 (MMBbls) |
P50 (MMBbls) |
P10 (MMBbls) |
Mean (MMBbls) |
|
13.0 |
26.8 |
47.5 |
28.8 |
|
|
|||
|
Total Penobscot - Recoverable Oil in Place |
|||
|
P90 (E6M3) |
P50 (E6M3) |
P10 (E6M3) |
Mean (E6M3) |
|
4.2 |
7.9 |
12.8 |
8.2 |
|
|
|||
|
P90 (MMBbls) |
P50 (MMBbls) |
P10 (MMBbls) |
Mean (MMBbls) |
|
26.4 |
49.2 |
80.3 |
51.6 |
Deep Penobscot
A Late Jurassic carbonate bank edge extends beneath the Penobscot discovery well TD. Although tight carbonates were encountered in the L-30 well, there is potential for porosity development at the margin edge.
Prospectivity of Parcels 2-6
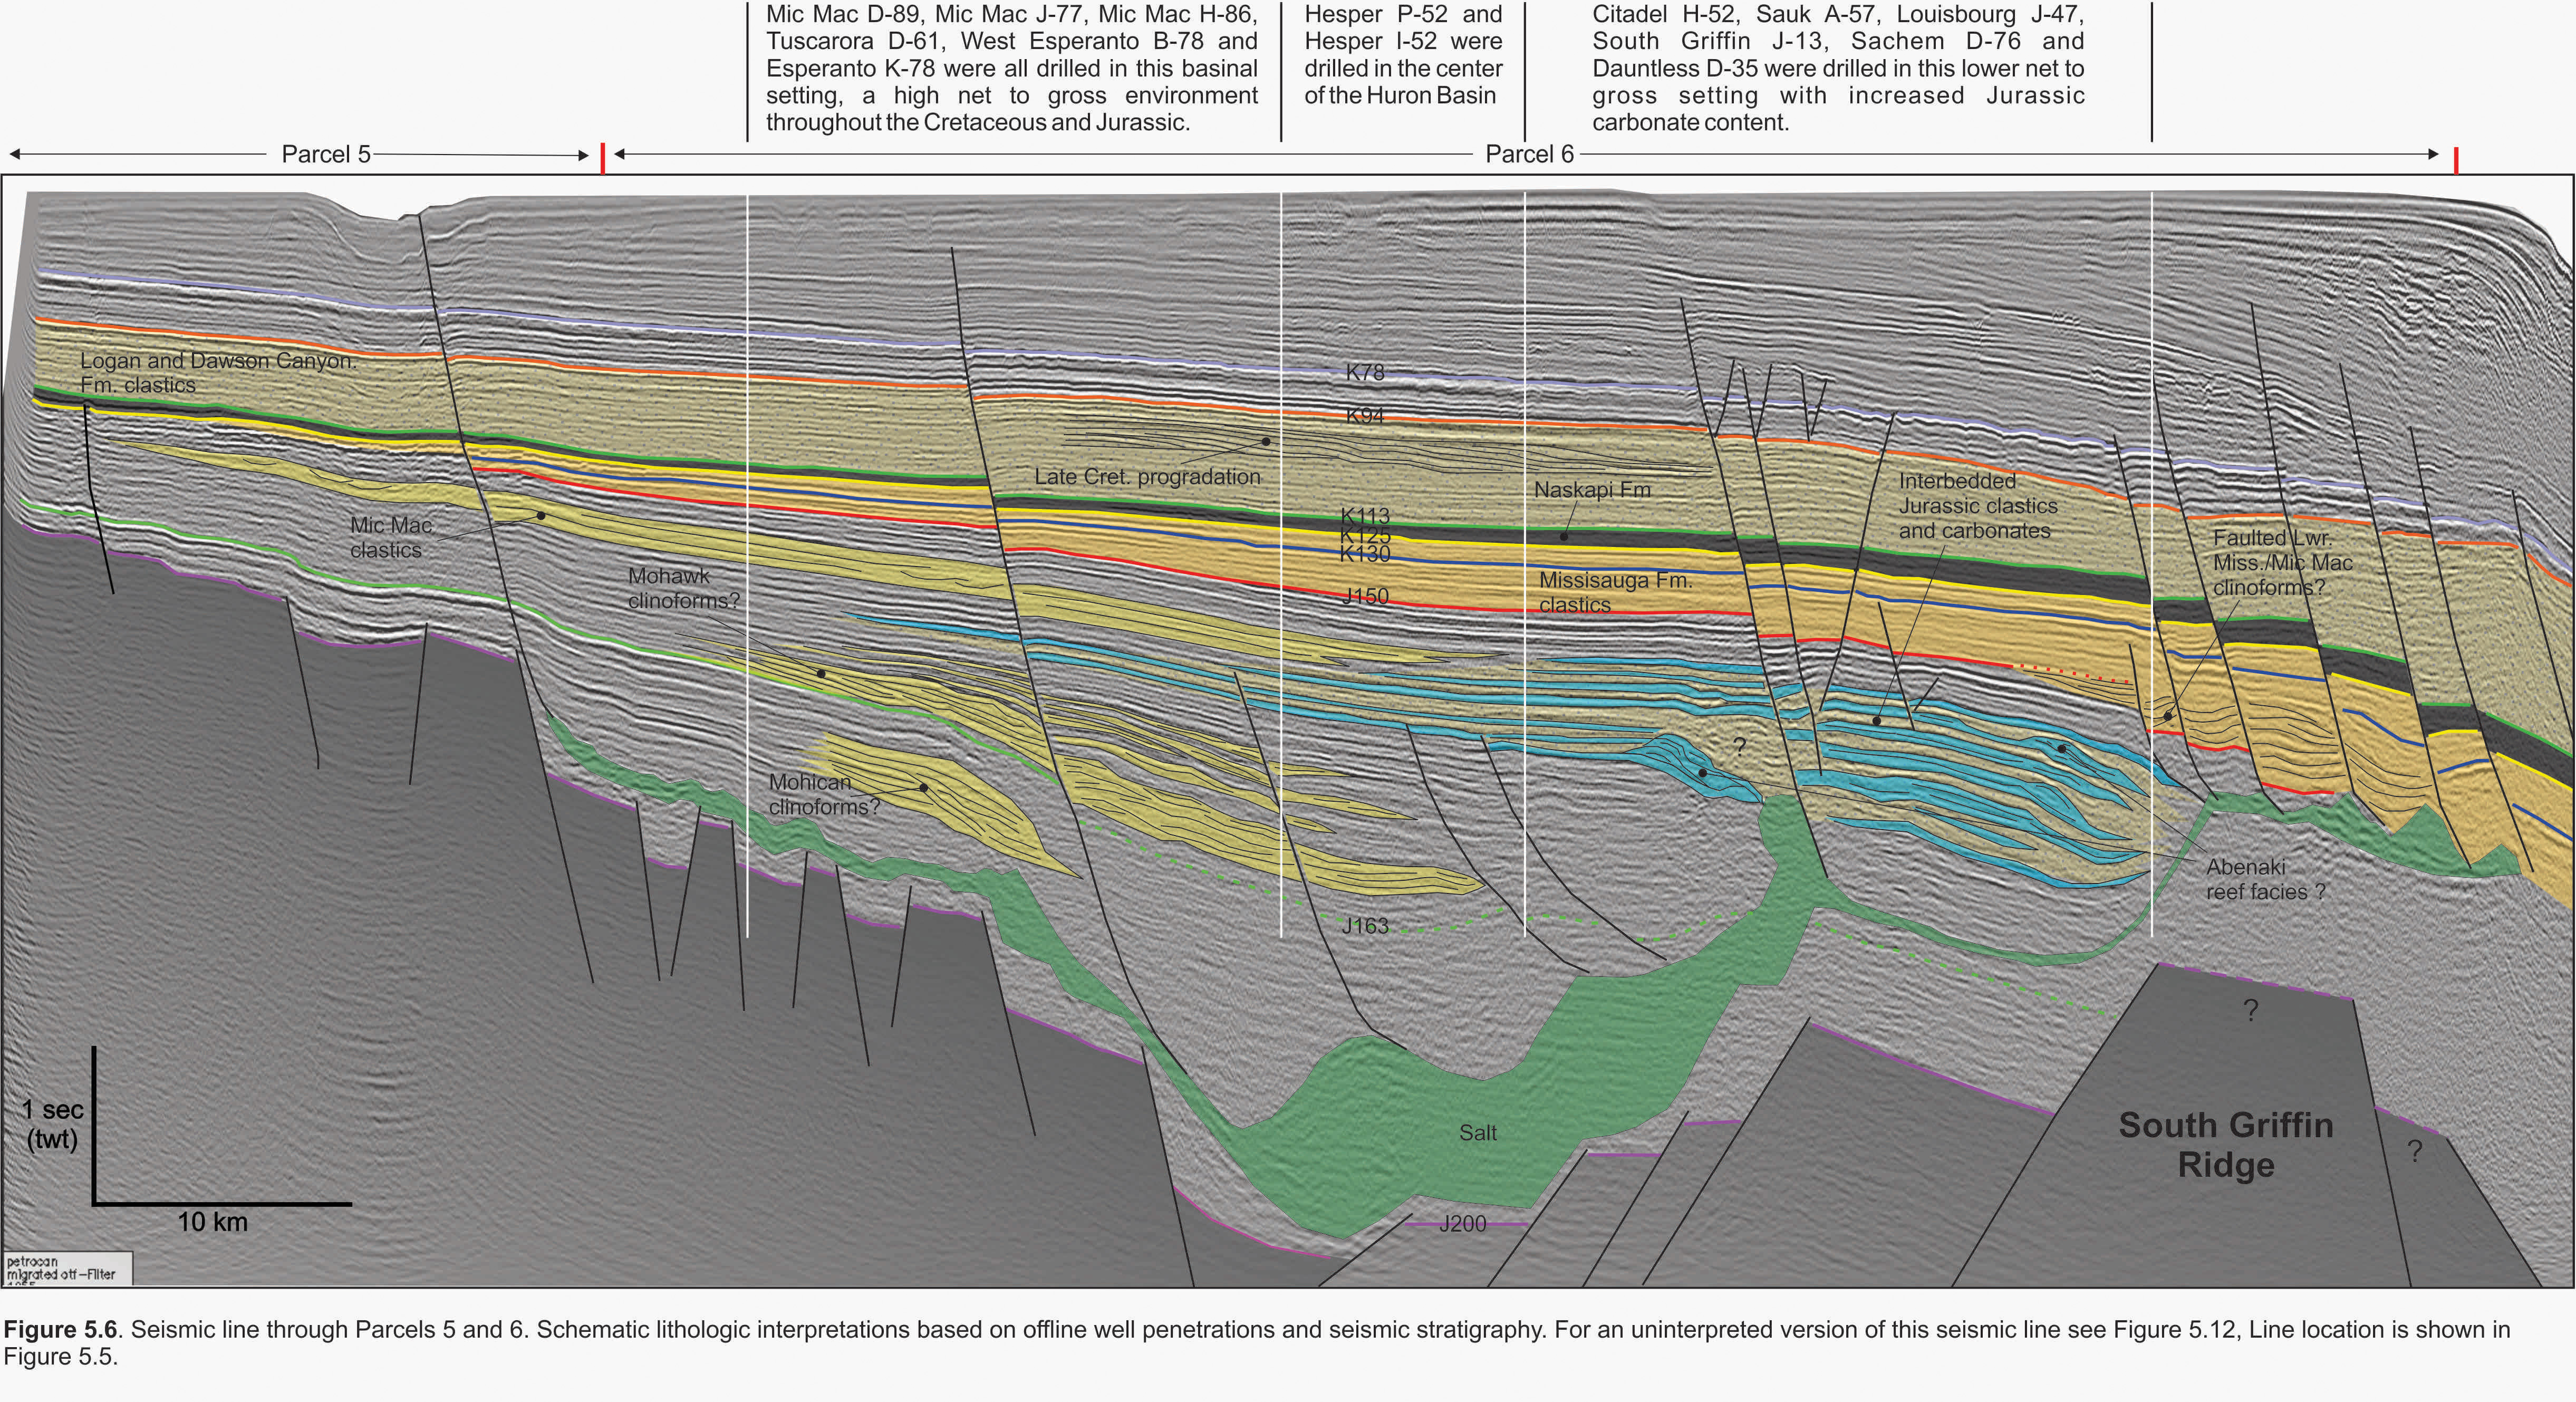
There are 28 wells drilled throughout Parcels 2-6 in the Abenaki and Huron subbasins. These wells tested four basic plays/structure types: 1) salt crest and shallow salt flanks 2) forced-folds over basement related highs 3) rollover anticlines and 4) interbedded clastics and carbonates (Figure 5.6).
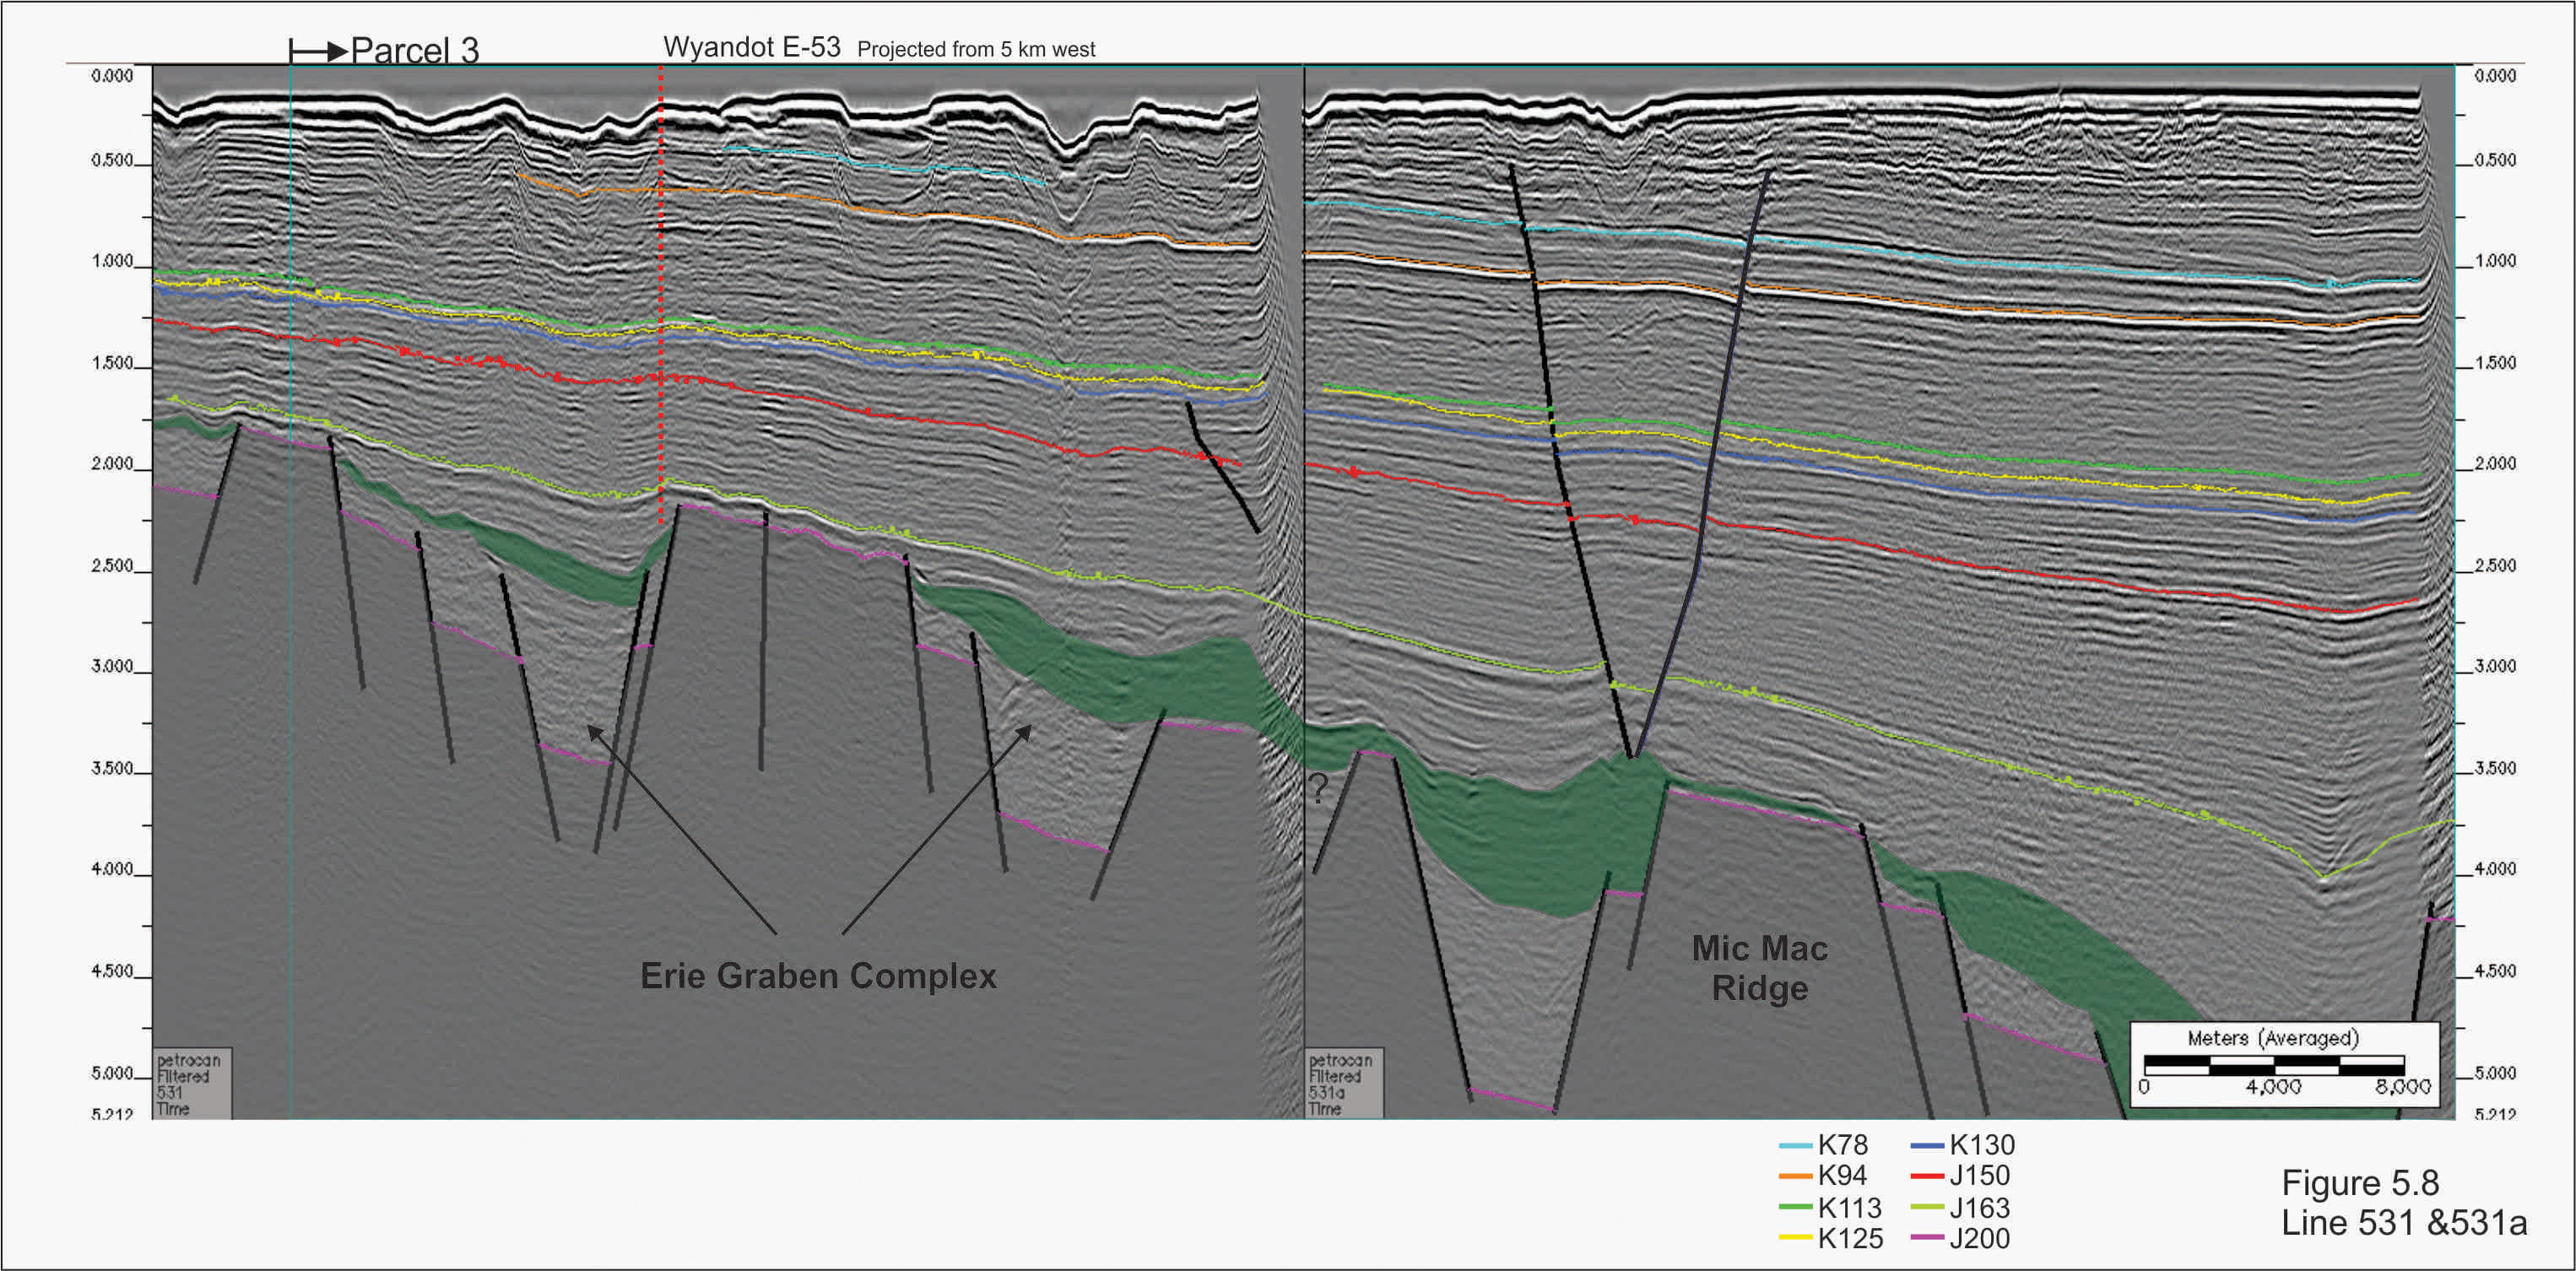
The salt-related plays tested condensed onlapping strata in 1970 with no success (Iroquois J-17, Huron P-96, Chippewa G-67 and Chippewa L-75). Erie D-26 and Wyandot E-53 tested forced folds over basement highs within the Erie Graben Complex; a thin oil zone was encountered in Mohican sands at Wyandot (Figure 5.8). Forced fold tests on the Missisauga Ridge were not successful (Missisauga H-54 and Peskowesk A-99).
The rollover anticlines tested proximal regions of the basin where the Jurassic and Cretaceous deposits have a high net to gross where there may be a lack of an adequate sealing horizon (Figure 5.6). These wells were either wet (Tuscarora D-61, Esperanto K-78 and West Esperanto B-78) or had thin oil columns (Mic Mac J-77 and Mic Mac D-89).
A test of folded, interbedded clastic and carbonate systems was successful at Louisbourg J-47 and gas was encountered in a 13 m Mic Mac Formation sand.
Wells drilled across Parcels 2-6 have proven there is a working petroleum system (for both oil and gas) in this area. One of the risks in these parcels may be seal. Play tests in proximal positions in these parcels show an abundance of both Jurassic and Cretaceous coarse grain siliciclastics. The Naskapi shale may provide a top seal for upper Cretaceous sands when an adequate shale thickness is attained (Figures 5.6 and 2.18).
Carbonates may also have potential to provide a Jurassic top seal in this high net to gross environment. The proper combination of thick porous Jurassic sands and sealing carbonates may exist inboard of the Louisbourg J-47 well where few wells have been drilled (Figure 5.6). For traps identified within the central parts of these parcels (i.e. between the Esperanto and Louisbourg wells) the required balance of reservoir quality sand and sealing carbonates may be encountered.
Other untested plays such as Abenaki carbonate reefs and subsalt plays are discussed further in the below Parcel specific sections.
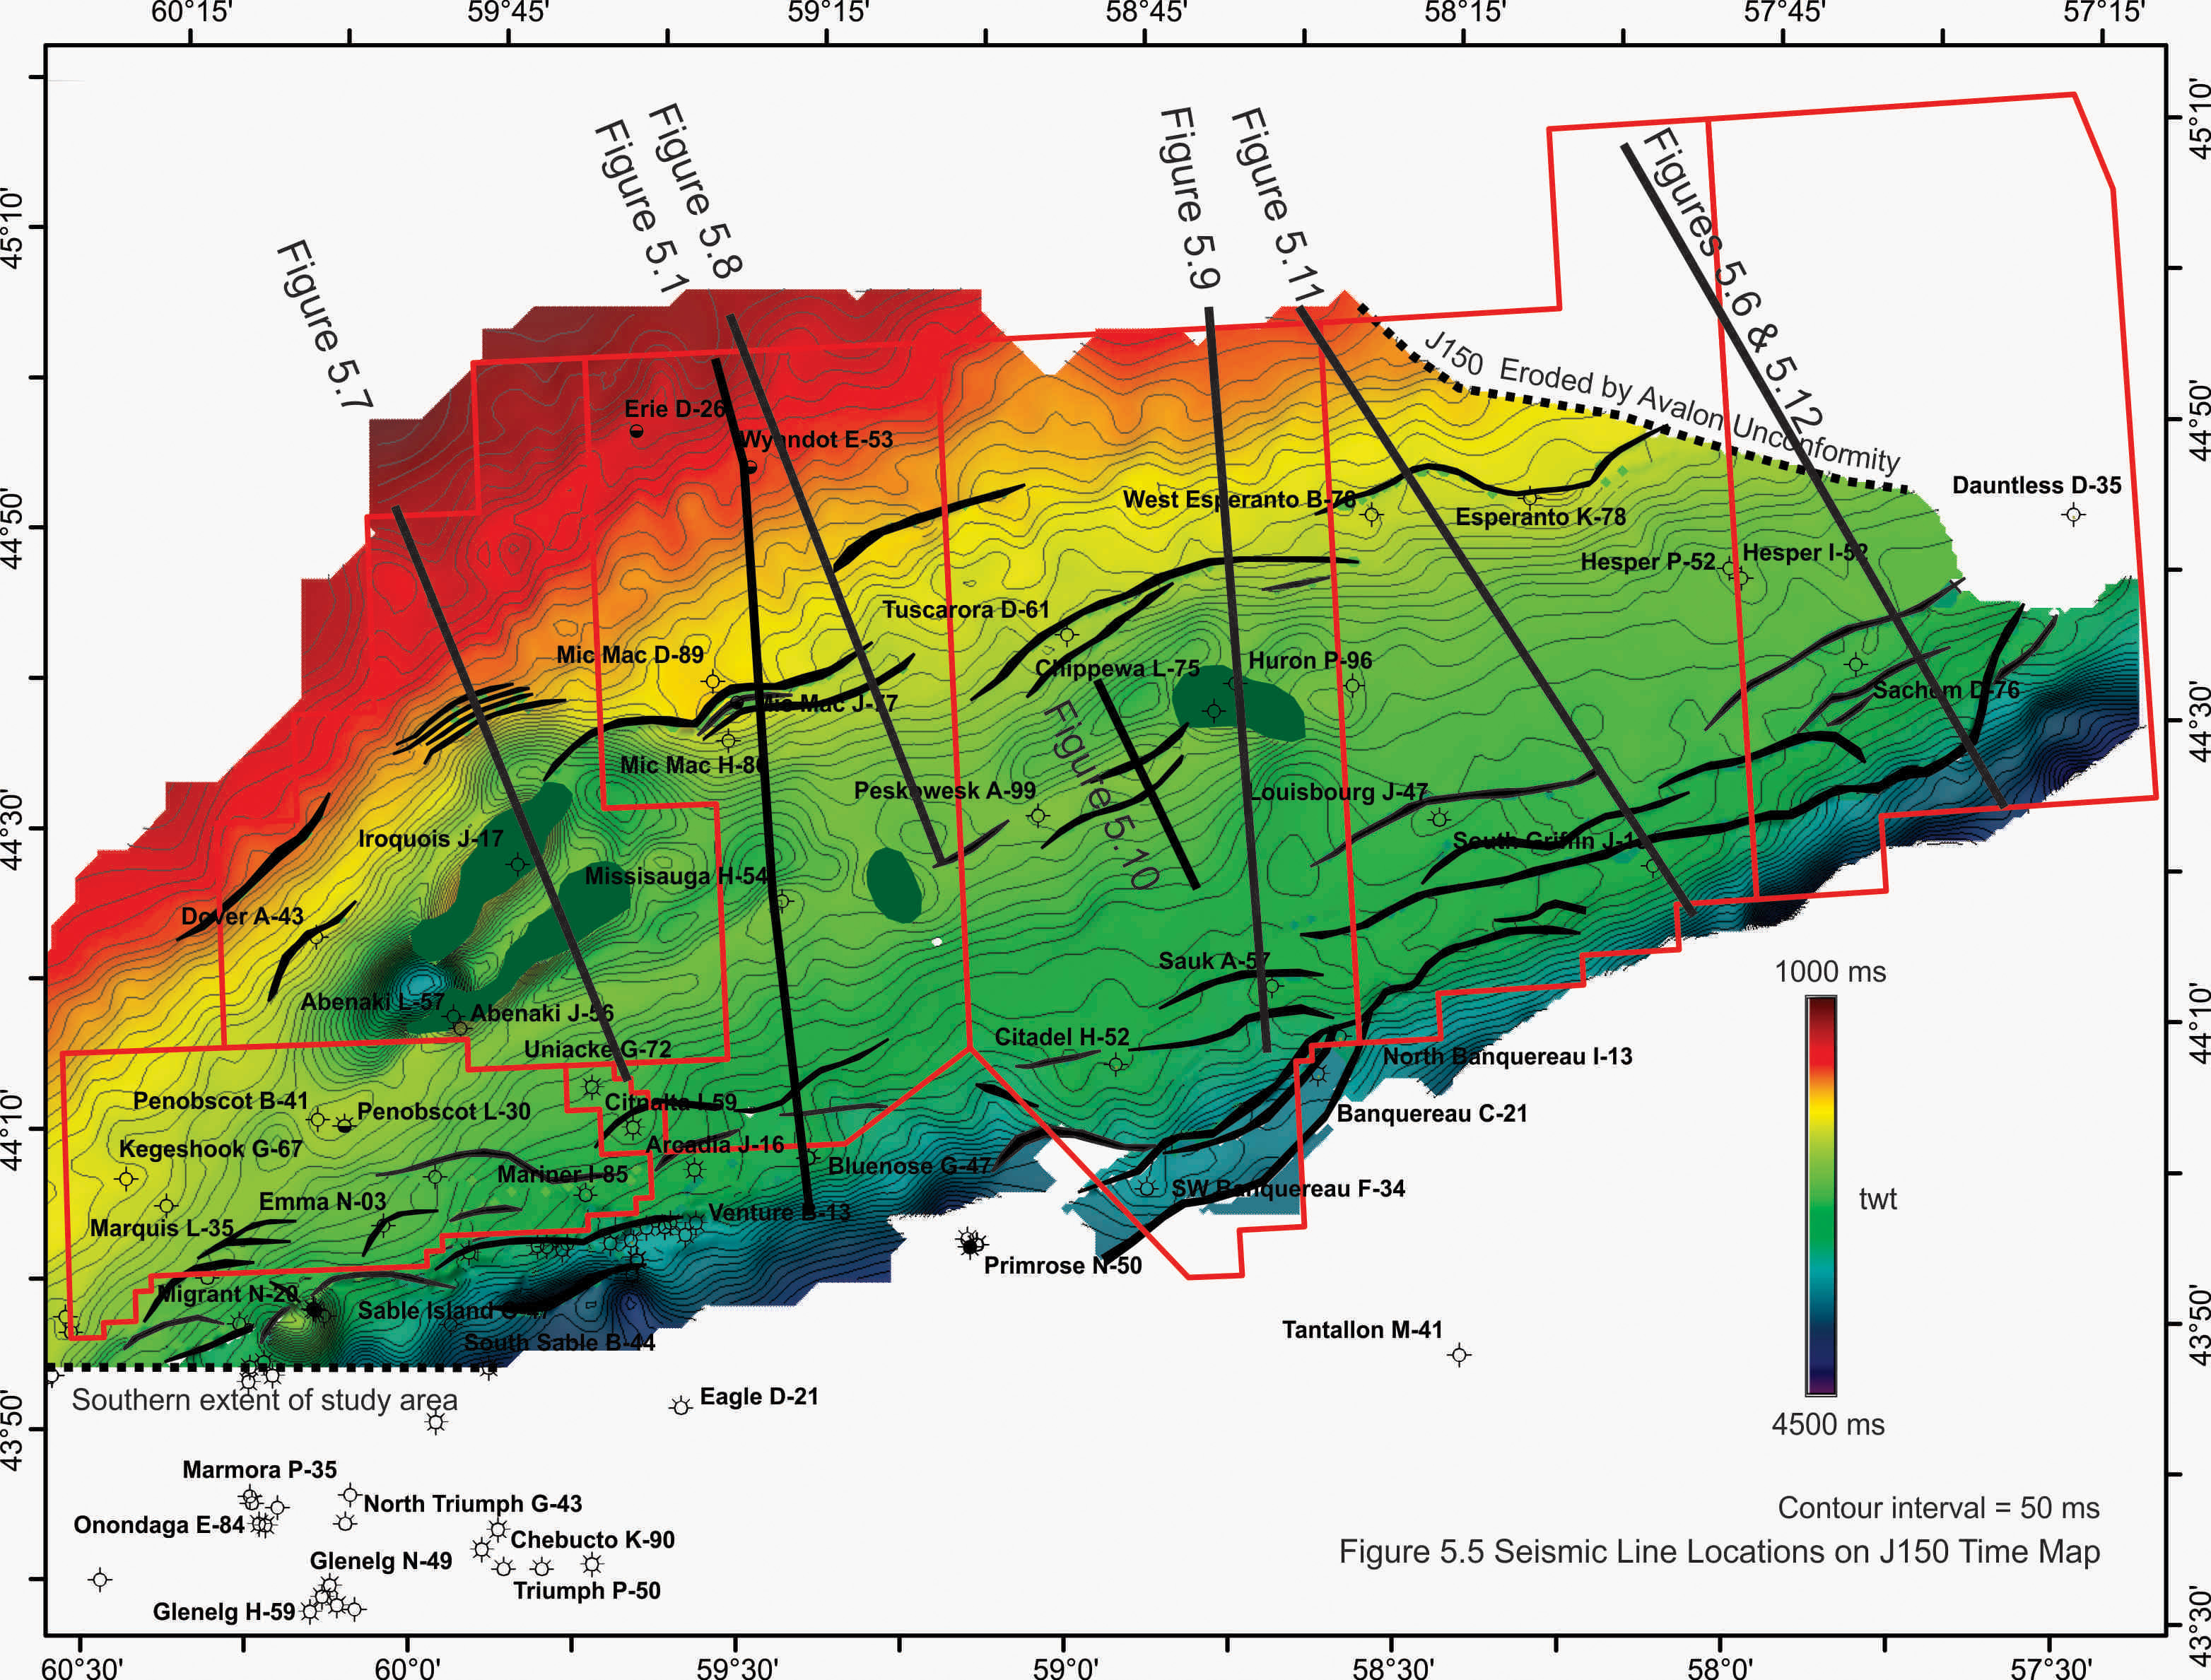
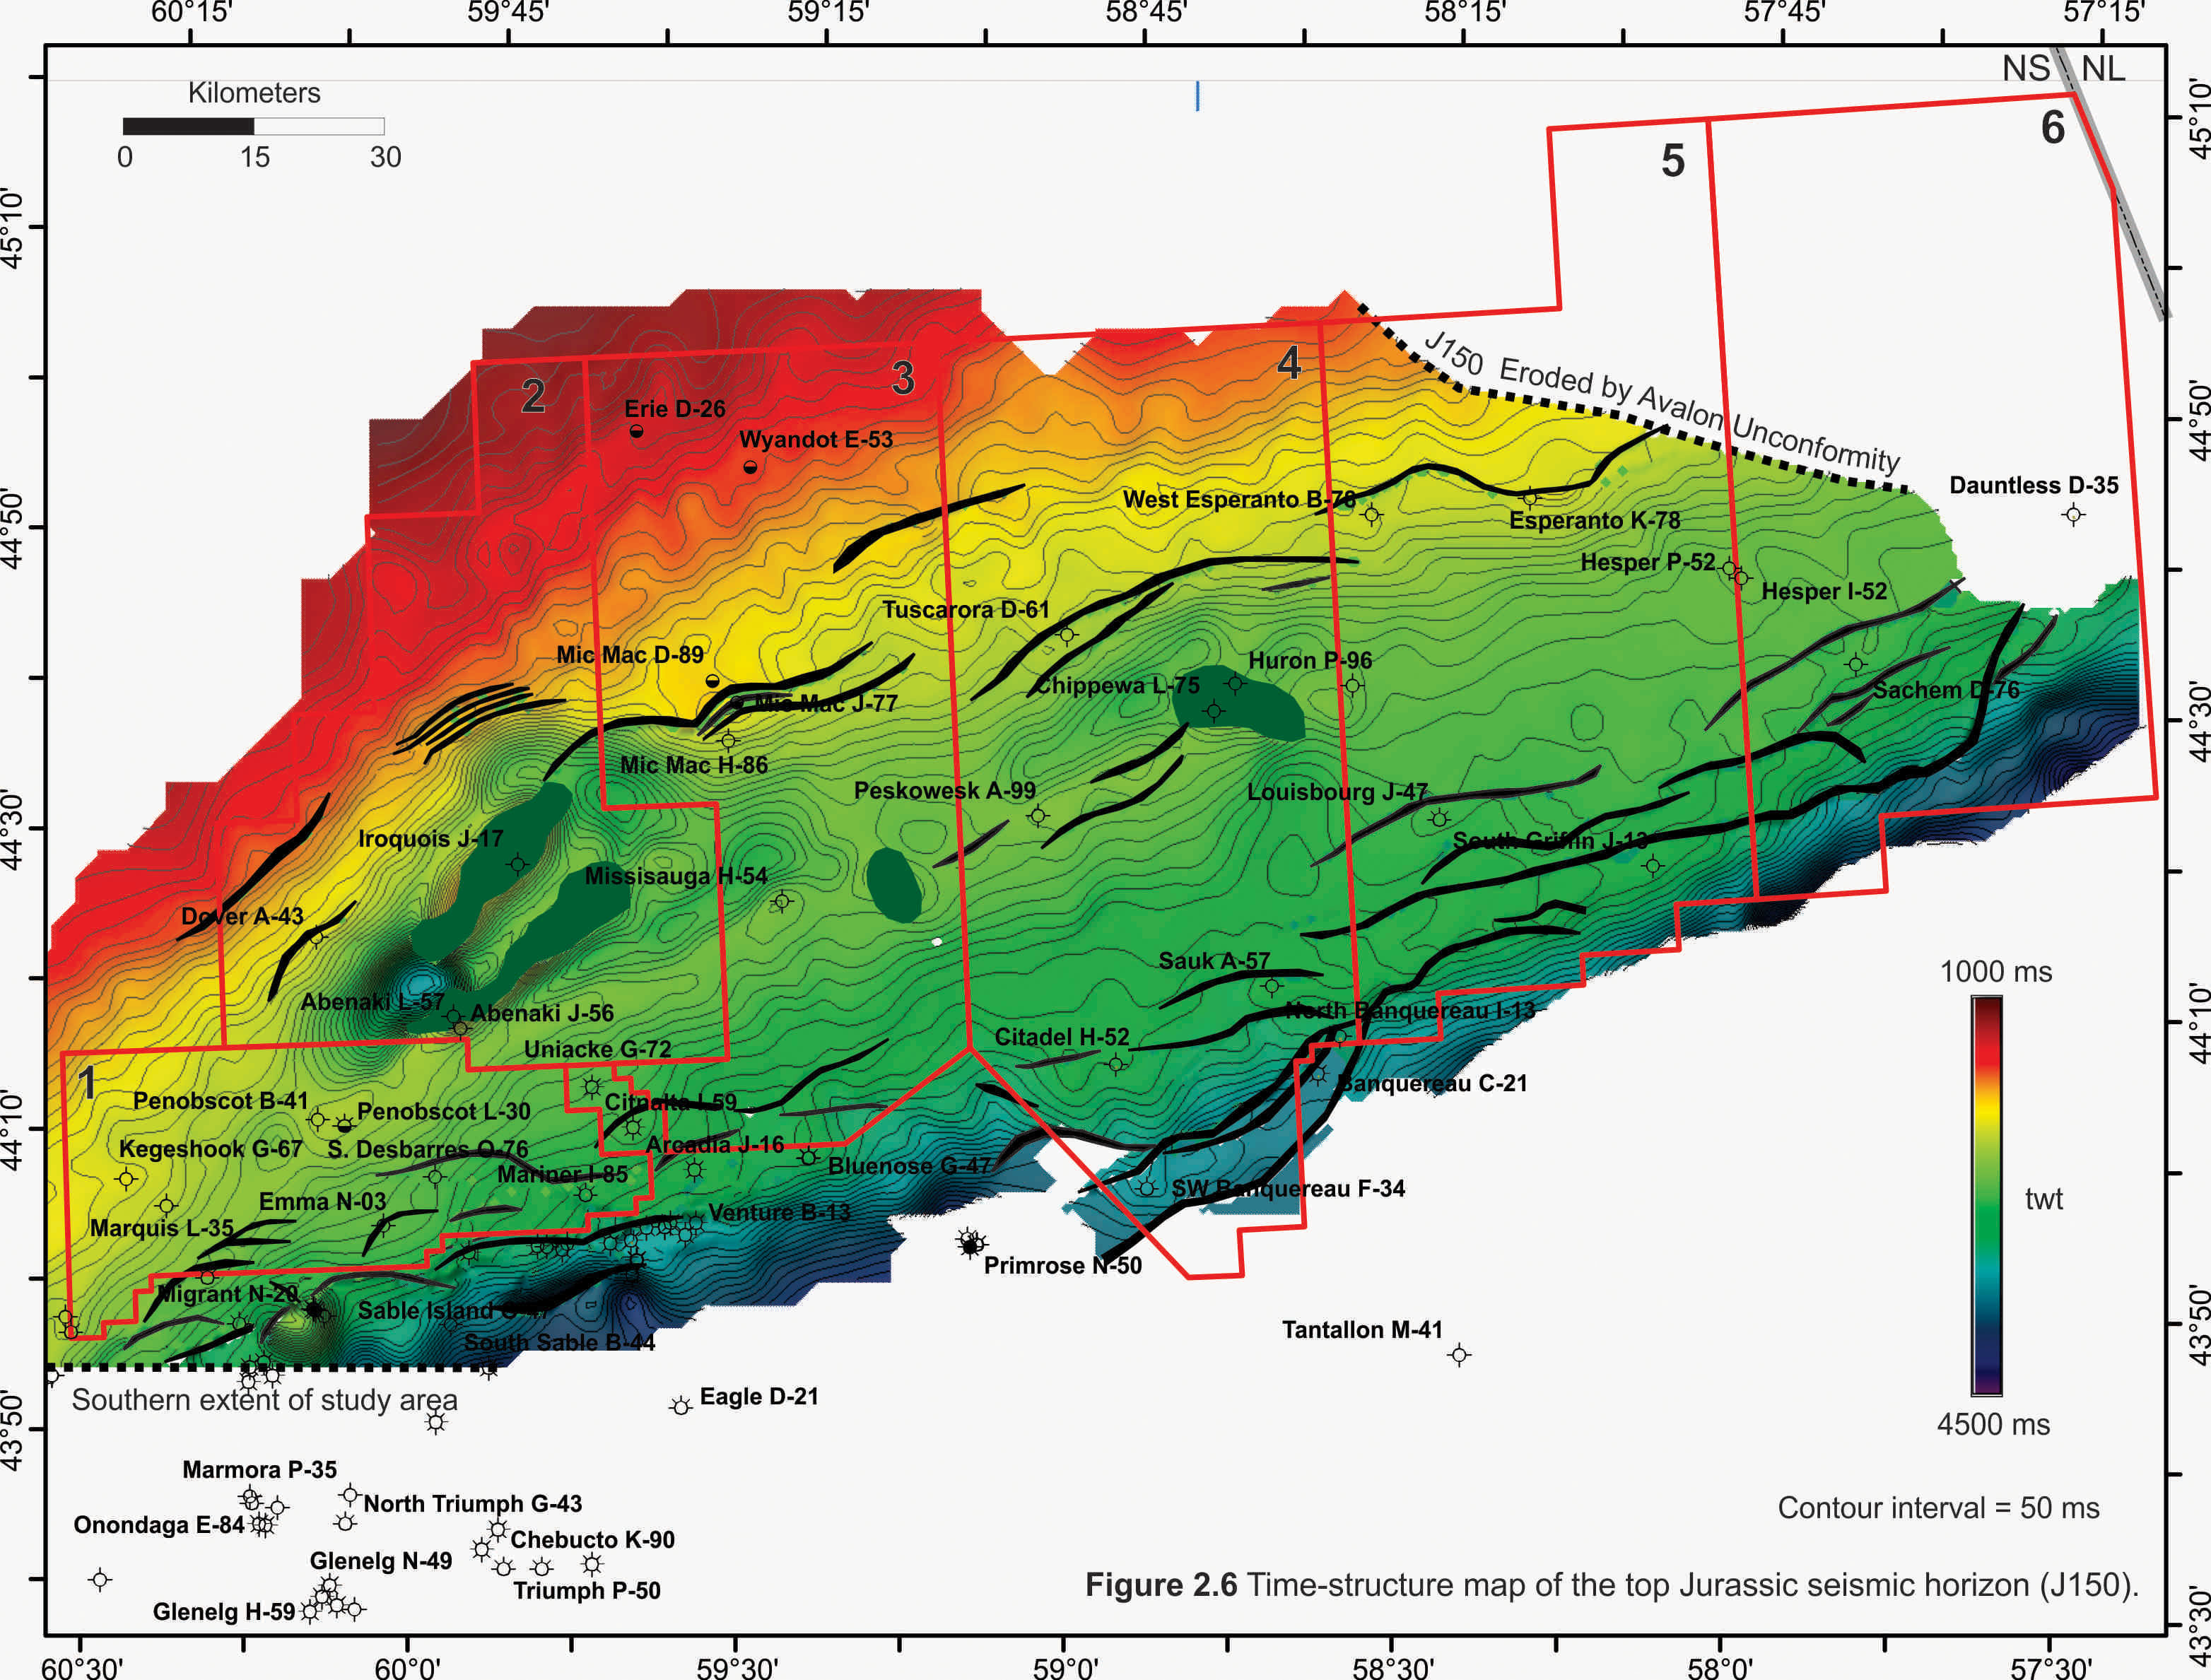
Parcel 2
Figure 5.5 shows the J150 horizon time structure map, indicating locations of the seismic line used to highlight features on Parcels 2-6. The best quality seismic data in the most favourable locations cannot currently be shown because of data disclosure policies.
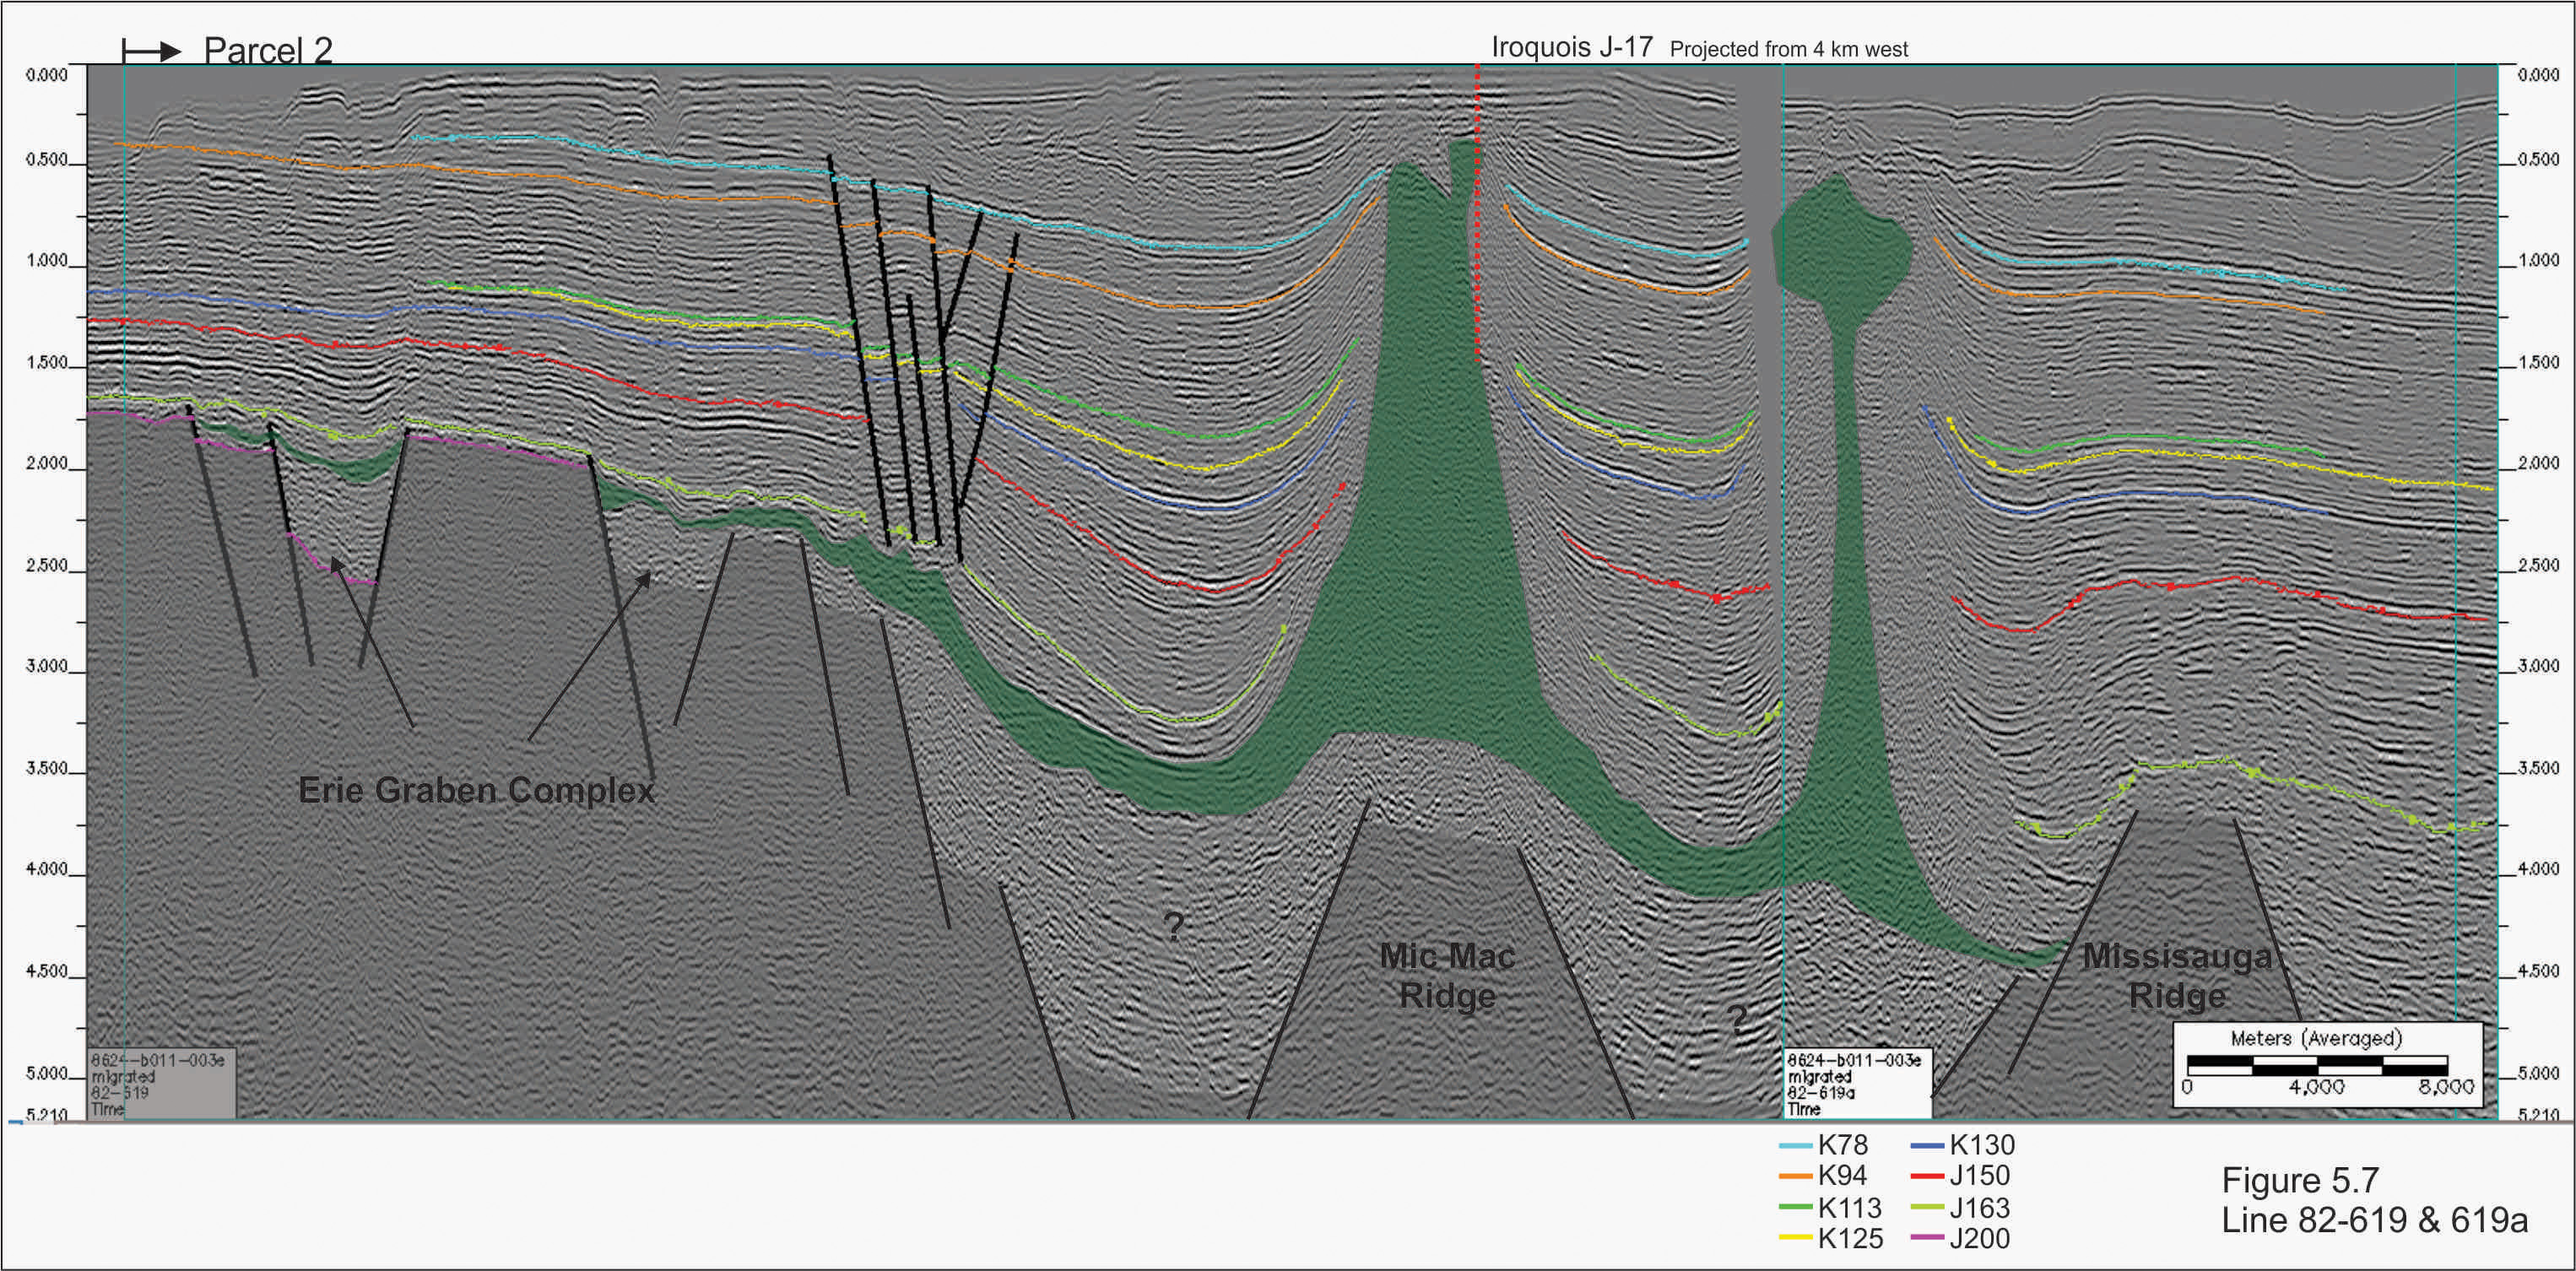
Figure 5.7 displays Husky (1982) dip lines 82-619 and 82-619a through Parcel 2, starting on the LaHave Platform, crossing the Erie Graben Complex and continuing into the Abenaki Subbasin. The Iroquois diapir above the Mic Mac Ridge has only been tested by one well, Iroquois J-17 drilled in 1970 that encountered minor oil staining. This seismic line illustrates the poor quality of the salt imaging even though this data was acquired more than 12 years after the diapir was drilled. Improved definition of salt structures using 3D seismic could define potential traps along this 20 km long diapir.
The Abenaki salt diapir is adjacent to the Missisauga Ridge. This 30 km long diapir was penetrated by two wells in 1970, 27 km west of this line. Abenaki L-57 had minor oil staining and Abenaki J-56 had gas charged mud. New 3D seismic could also identify potential traps along this system.
Above the Missisauga Ridge there is potential for roll over closure NE of the Abenaki Diapir on the J150 horizon (Figure 5.5 & 2.6) and SE of the diapir on the J163 horizon (Figure 2.5). There is also turtle structuring in this area as a result of salt evacuation into the diapir.
With improved imaging, a subsalt play could also be developed both in the Erie Graben Complex and in the Abenaki Subbasin. This is shown on Figure 5.8.
Parcel 3
Figure 5.8 presents Petro-Canada (1982) dip lines 531 and 531a through Parcel 3 starting on the La Have platform, crossing the Erie Graben Complex and passing 5 km east of Wyandot E-53 (1970). The high net to gross and porosity of Missisauga and Mic Mac formation sandstones along with the thin Naskapi shale in this area require development of a local seal in order for a structure to be prospective.
Fair to good porosity in Mohican Formation sandstones at the base of the Wyandot E-53 well provides a promising exploration target throughout this graben complex. The combination of good quality Mohican sands, a well developed Misaine shale seal, and proximity to early Jurassic source rocks could be prospective.
The untested subsalt section could also be prospective in the Erie Graben Complex given its relatively shallow burial depth and proximity to possible Late Triassic source rocks.
The seismic line continues over the Mic Mac Graben which lies above the Mic Mac Ridge. This graben is along trend with minor oil pay in the Mic Mac J-77 (1970) and Mic Mac D-89 (1970) wells which are 18km to the east. J-77 is drilled into the central area of the graben while D-89 tested a small closure on the footwall of the northern fault. The Naskapi Member begins to thicken in this area providing better sealing potential.
Extensions of the bounding faults for the Citnalta and Arcadia Significant Discoveries (SD) trend across the southern portion of Parcel 3 (Figure 5.5). These SDs have gas pay in Missisauga and Mic Mac sandstones. The Citnalta gas sands also have unusually high liquids content.
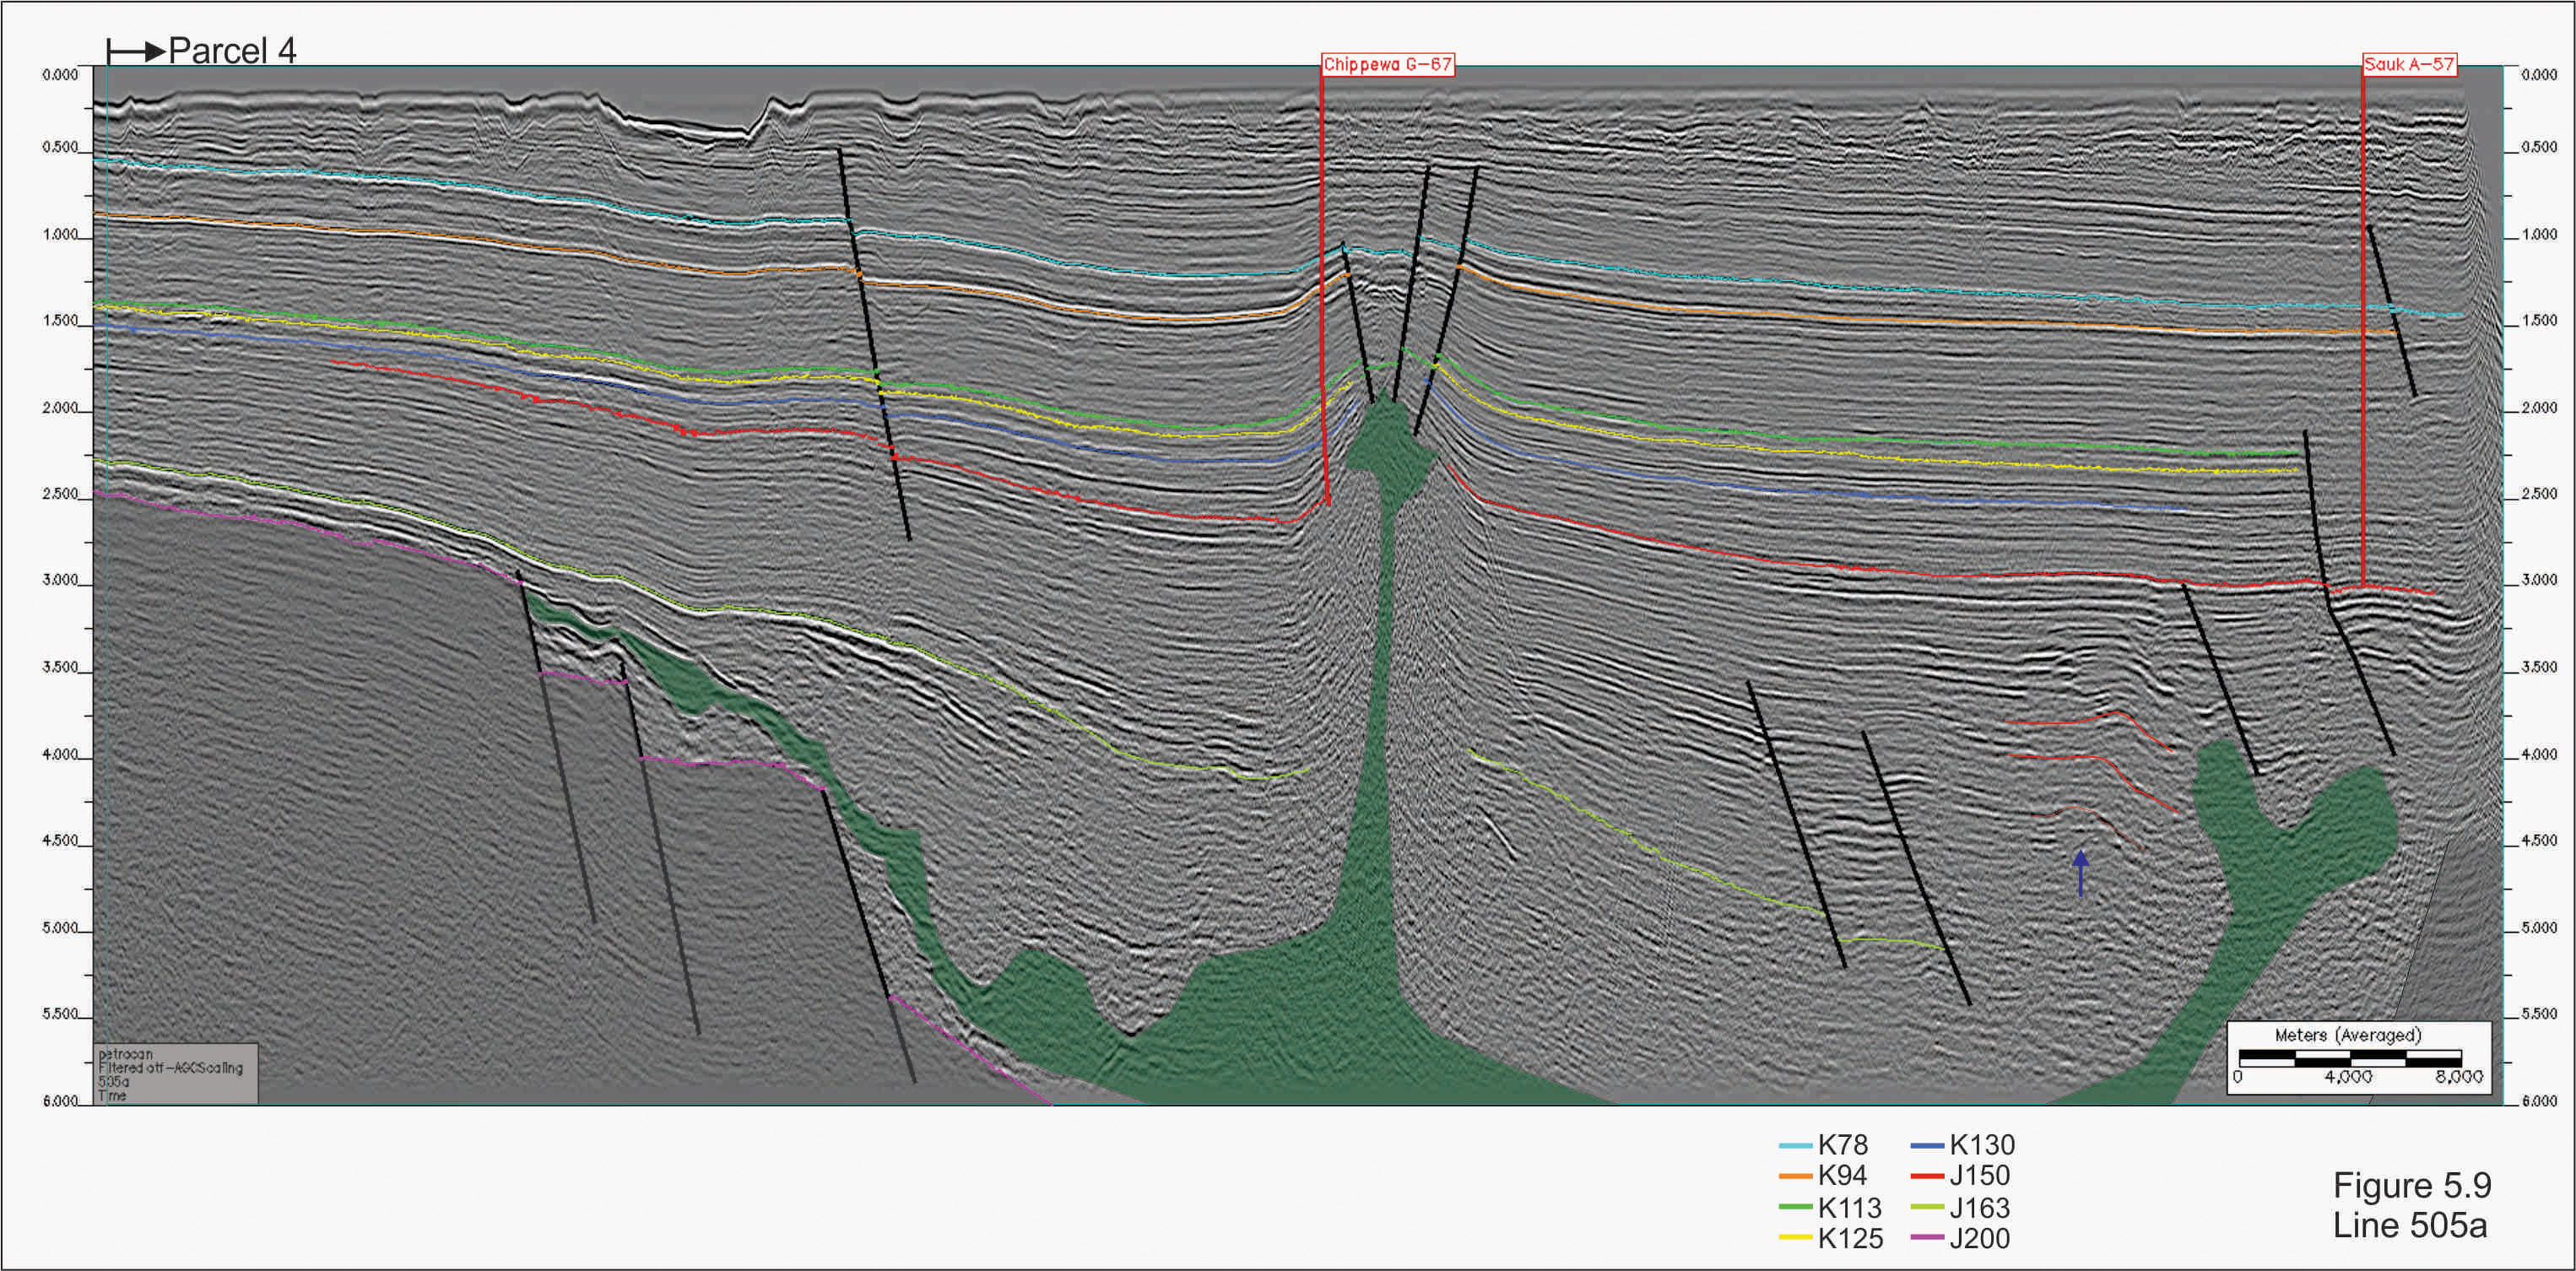
Parcel 4
Figure 5.9 illustrates Petro Canada (1982) seismic dip line 505a through Parcel 4 with rapid expansion of the Early Jurassic succession into the Huron Subbasin. Chippewa G-67 (1970) was drilled on the flank of a salt diapir encountering minor oil staining in Missisauga sandstones. Positioning of this well on the salt structure in 1970 was probably suboptimal given the seismic quality.
This line reveals a poorly imaged, but thick, untested, Late Jurassic, stacked carbonate reef buildup at around 4.5 seconds (blue arrow and red highlights).The reef is better imaged on more recent seismic data and has not been penetrated by any wells. The reef is similar in morphology to the Deep Panuke gas field, although here it was buried earlier by clastics, possibly near Kimmeridgian time. The reef complex at Deep Panuke continued through the Tithonian and was buried by Missisauga sandstones. The nearby Sauk A-57 well just penetrates the top of the Jurassic at 4766m. Figure 5.10 illustrates that there is also potential for the development of Early Jurassic Iroquois or Middle Jurassic Scatarie bioherms along the Missisauga Ridge during periods of rising sea level or flooding.
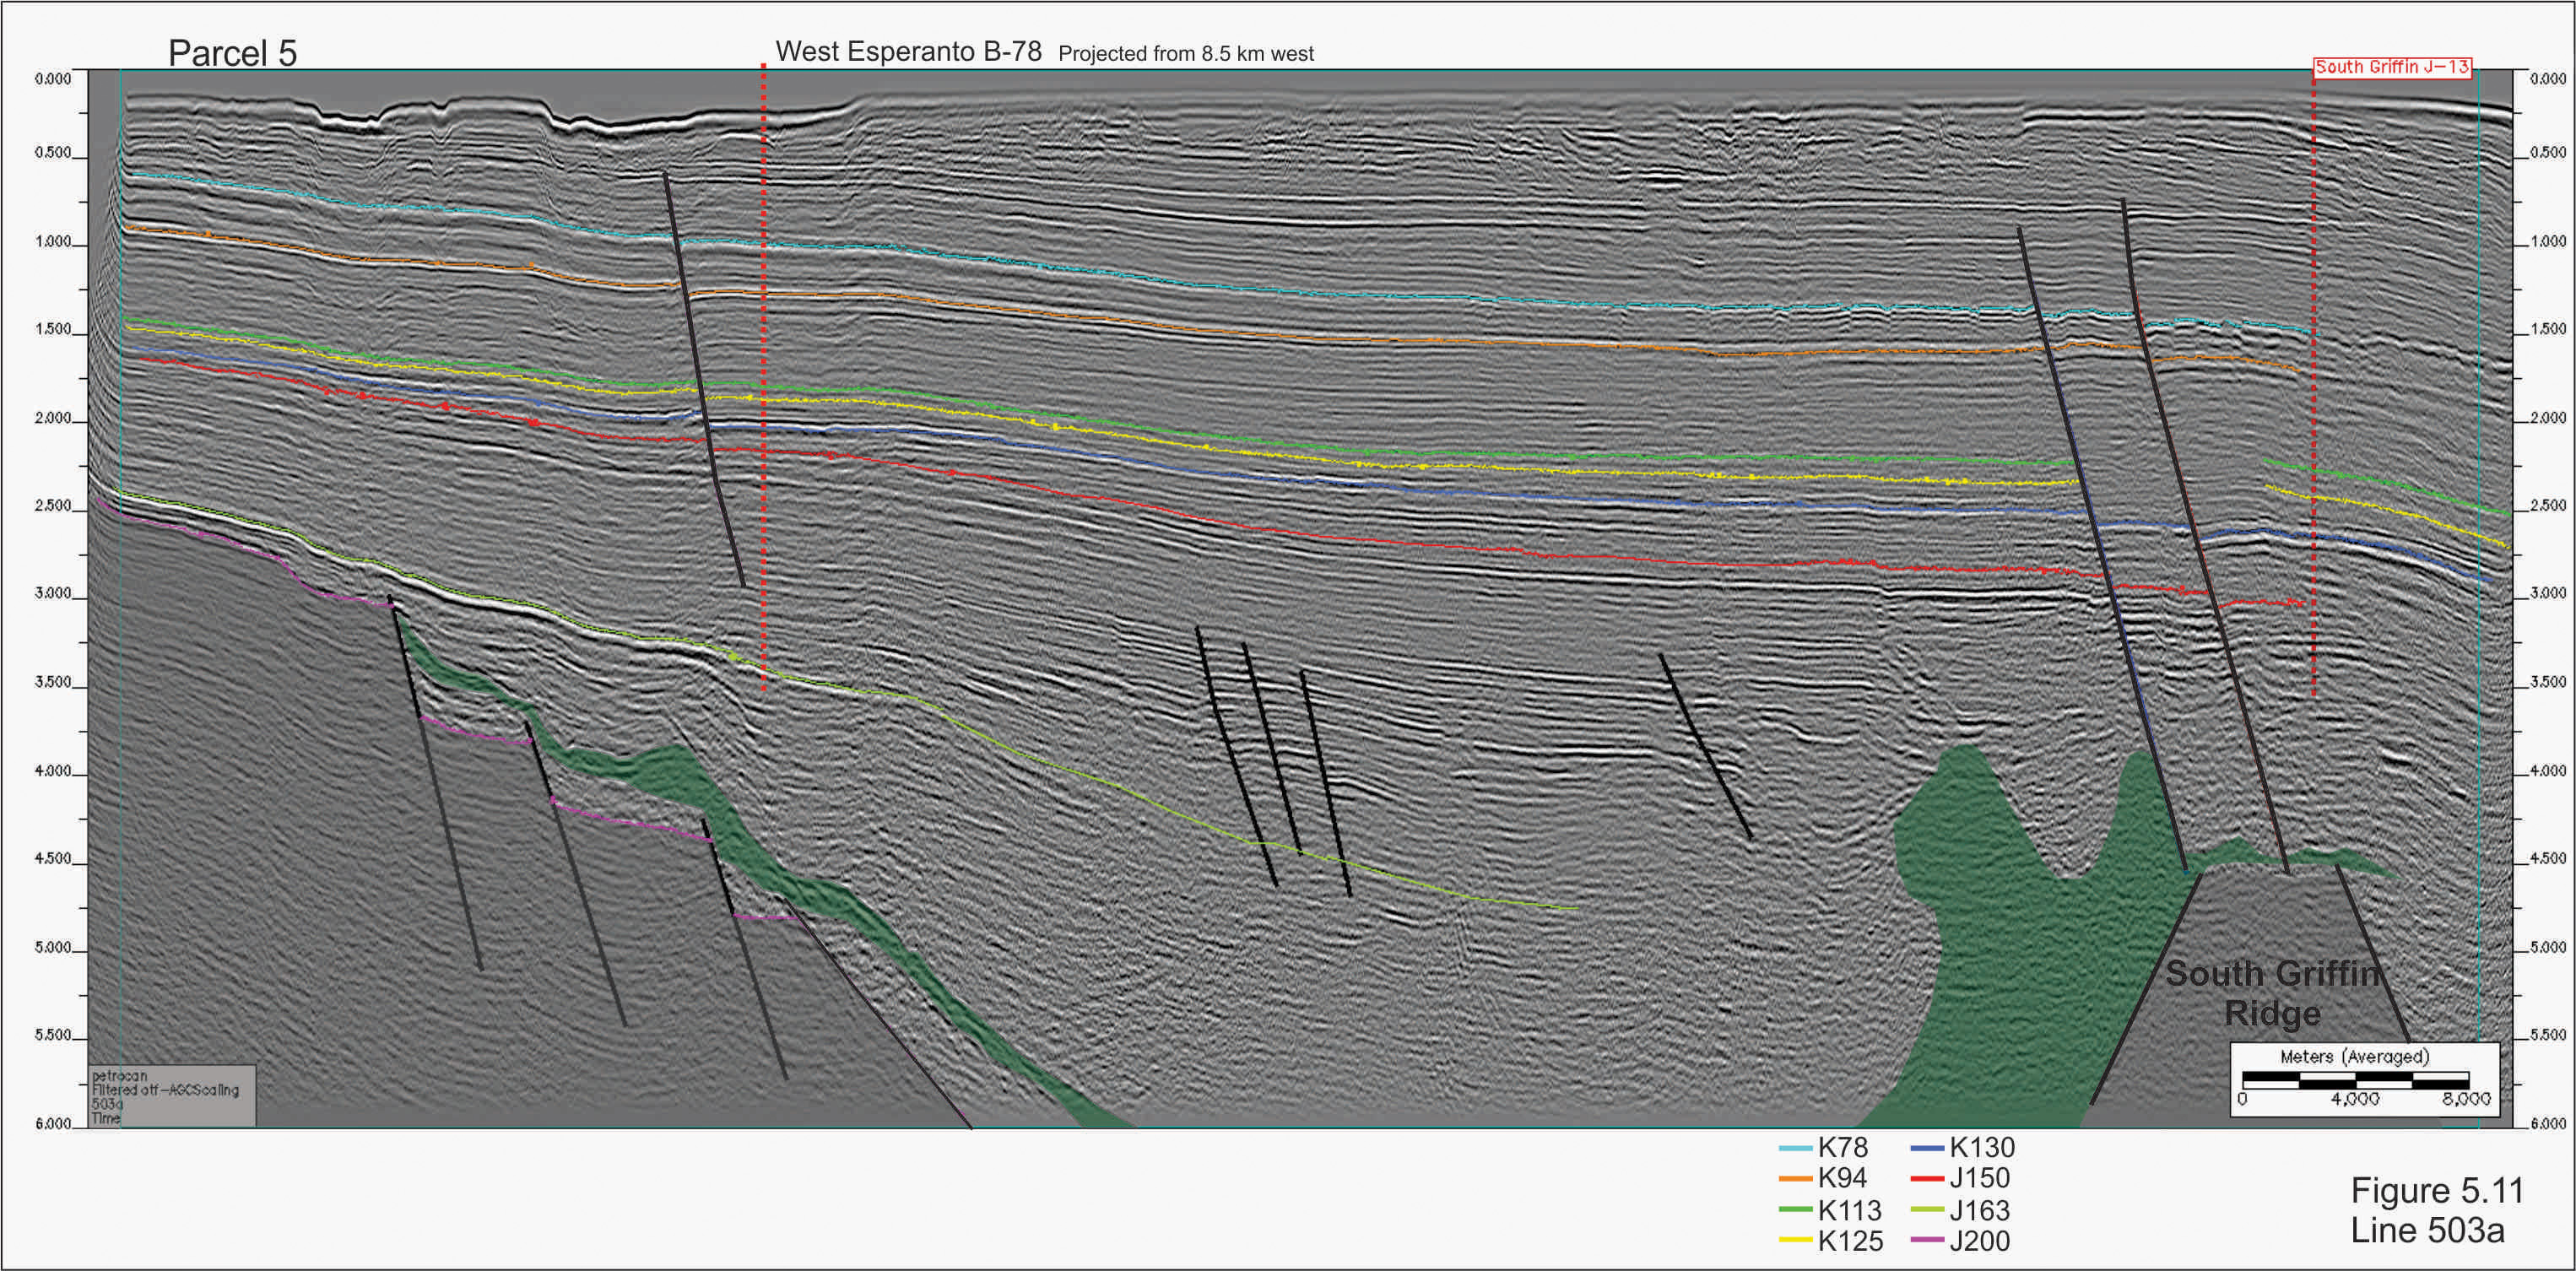
Parcel 5
Figure 5.11 shows Petro Canada (1982) dip line 503a through Parcel 5 starting on the LaHave Platform, across the faulted basin hingeline, out into the Huron Subbasin and continuing to the South Griffin Ridge. Salt evacuation and diapirism has strongly influenced Jurassic Mic Mac progradation into the Huron Subbasin as detailed in Figure 5.6. Good Jurassic reservoir sands at Esperanto K-78 can be correlated to clinoforms that are expanding into this basin.
Salt expelled along the South Griffin Ridge provides opportunities for traps that could be defined with 3D seismic data.The South Griffin J-13 well (1984) was drilled to 5900m in the Late Jurassic Mic Mac above the South Griffin Ridge. Although no hydrocarbons were encountered in this well, the South Griffin Ridge provides plenty of faulting and structuring with the Naskapi shale providing a much better seal in this area.
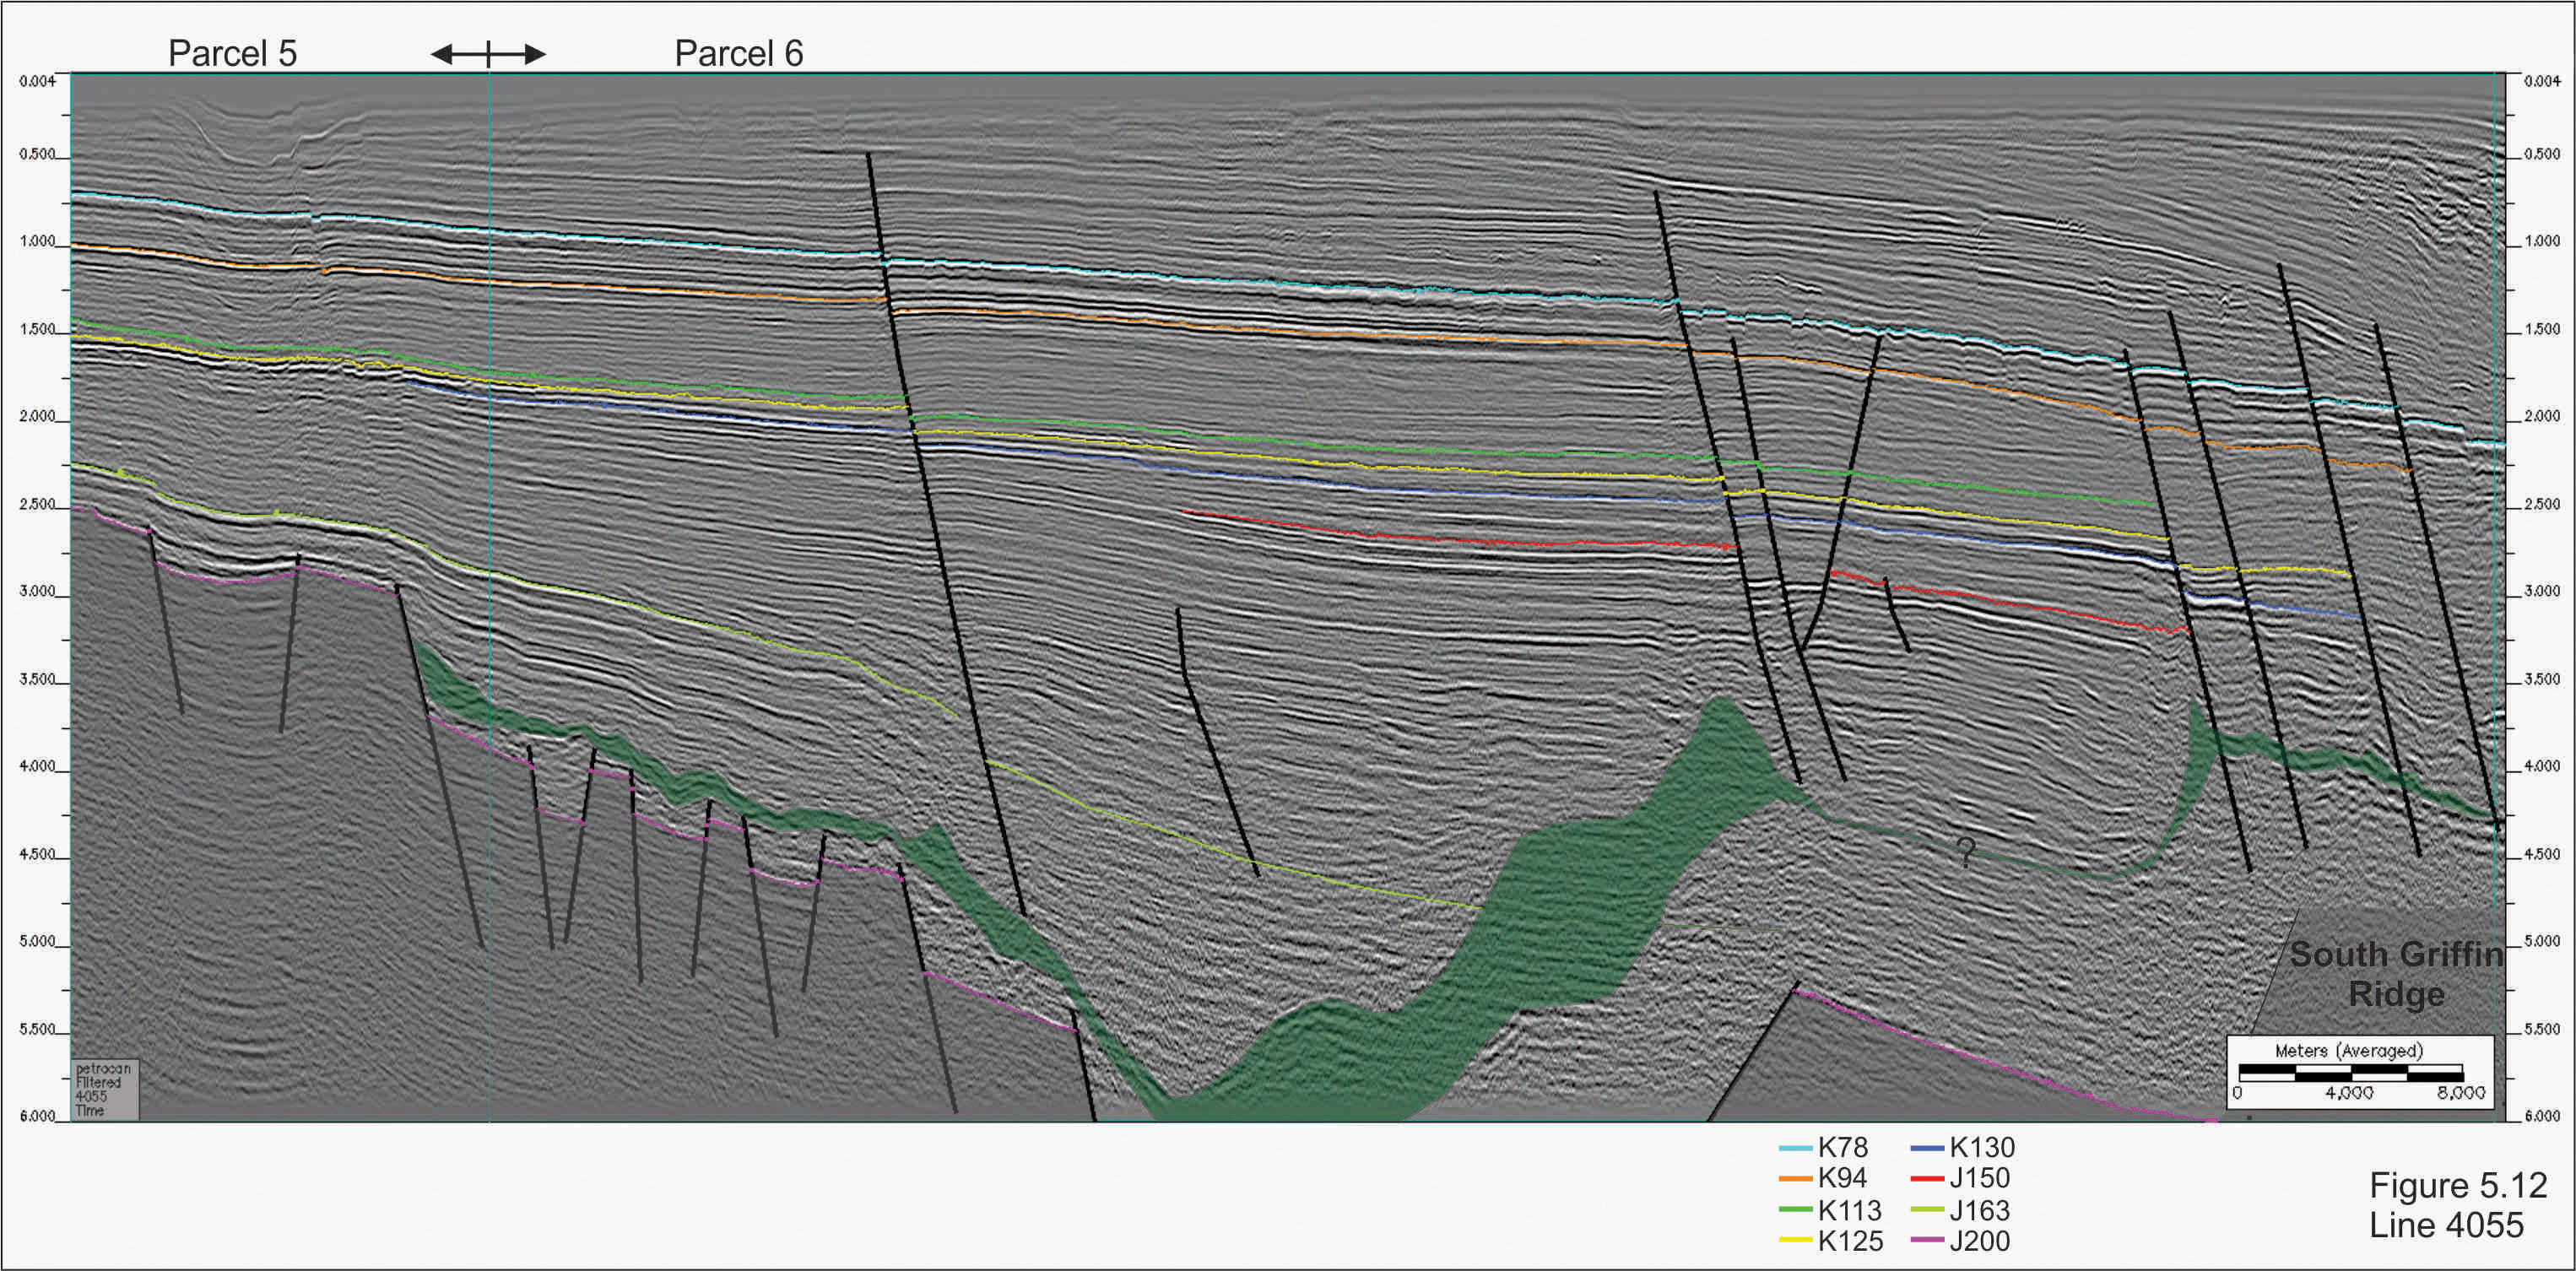
Parcel 6
The Petro Canada (1982) dip seismic line 4055 selected to illustrate play concepts in Parcel 6 also crosses a small portion of Parcel 5 on the LaHave Platform (Figure 5.12). This line intersects numerous Jurassic and Cretaceous progradational packages interpreted to consist of both clastics and carbonates. This line is also shown in Figure 5.6 with an enhanced interpretation based on lithologies intersected in nearby wells.
Potential plays within Parcel 6 are rollover anticlines in the high net to gross Jurassic and Cretaceous intervals, subsalt traps in the southern end of the parcel near the South Griffin Ridge (beneath a poorly imaged salt canopy?) and interbedded clastic and carbonate systems similar to that penetrated in the Louisbourg J-47 well (Figures 5.6 and 5.12).


