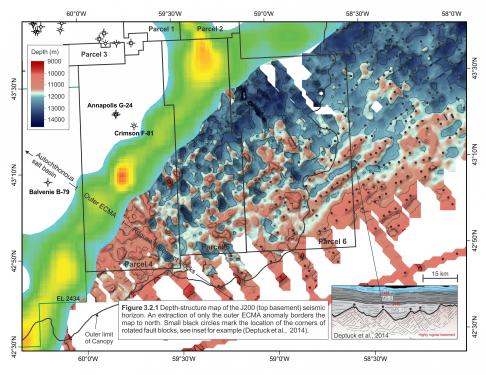
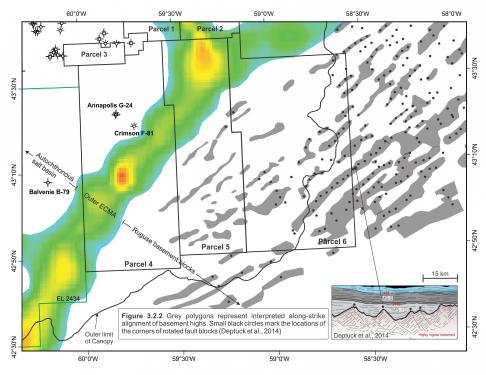
Seismic imaging of the basement beneath the central Scotian Slope is generally poor due to the presence of complex allochthonous salt bodies and a very thick (>14km) post-rift stratigraphic succession. In addition, the J200 seismic horizon (approximate base Jurassic and top basement) is not easily mapped in 3D seismic surveys (where imaging is better) due to the short seismic record length that is often clipped at 8-9 seconds (twt). Nonetheless, using previously published magnetics data (Oakey and Dehler, 2004) and recent observations from other studies (e.g. Deptuck et al., 2014), combined with careful mapping from available 2D seismic surveys, a top basement seismic horizon was interpreted with a moderate degree of confidence even beneath the extensive allochthonous salt canopies in the study area.
On the southwestern Scotian Slope the East Coast Magnetic Anomaly (ECMA) is interpreted to approximate the continental–oceanic boundary and its location is coincident with seaward dipping reflections observed on seismic profiles (Klitgord and Schouten, 1986; Keen et al., 1990; Dehler, 2010; Labails et al., 2010). The ECMA is also present along the central Scotian Slope but its trajectory shifts northward just west of the NS16-1 region as it crosses Parcels 4, 5 and 6. Seaward of the ECMA, the J200 marker was correlated along the top of highly rotated blocks interpreted to correspond to oceanic crust (Figure 3.2.1). This rugose basement continues along the eastern Scotian Slope, and in areas of improved seismic imaging (particularly where overlying allochthonous salt is thin or absent) there is an obvious linear NE-SW trend to the basement fabric that appears to be related to the development of brittle rotated crustal blocks (Figure 13 in Deptuck et al., 2014). In the study area, velocity effects from the overlying Sable Slope Canopy disrupt this basement fabric. A 3D velocity model generated for this study attempts to remove velocity artifacts associated with the overlying salt canopy and subsequent depth conversions of the J200 marker suggest that the NE-SW linear trend in the basement fabric continues underneath the Sable Slope Canopy (Figures 3.2.1 and 3.2.2). The sharp pointed crests of these rotated basement blocks show a high degree of alignment (red dots in inset; Figure 3.2.2; see also Deptuck et al., 2014), and the grey polygons attempt to show the distribution of the rotated fault blocks that were mapped with a higher degree of confidence.
The NE-SW trend generated by these rotated blocks does not appear to extend along or landward of the ECMA, and salt feeders commonly root down into a primary salt basin along or landward of the ECMA. This suggests that, as in the southwest (Deptuck, 2011; Deptuck et al. 2015) and northeast (Deptuck et al., 2014) portions of the Scotian margin, the ECMA coincides with an important structural boundary, and closely approximates the seaward boundary of the autochthonous salt basin. This observation is reinforced by the lack of salt feeders in the region of rotated basement blocks seaward of the ECMA. All mapped salt feeder systems that supplied salt to the Sable Slope Canopy are interpreted to originate from salt deposited above continental crust north of the ECMA.


