Potential Reservoirs
The Sediment Delivery Systems section of the 2012 Call for bids (http://www.callforbids.cnsopb.ns.ca/2012/01/ns12-1-parcels/central-scotian-margin-parcels-12-7-11/sediment-delivery-systems) offers an in-depth study describing the shelf edge trajectories and canyon systems found within the central Scotian Margin. There is abundant evidence that the necessary sediment transport systems exist to transport coarse clastic deltaic deposits from the shelf to deeper waters. The Annapolis G-24 well encountered coarse clastics within the deep water equivalent of the Mississauga Formation. These are the highest quality and thickest sands encountered to date on the Scotian Slope. Considering both the well results at Annapolis and the mapped sediment transport systems, the risk for encountering coarse-grained turbidite deposits within these parcels is considerably lower than most other regions on the Scotian Slope.
Traps
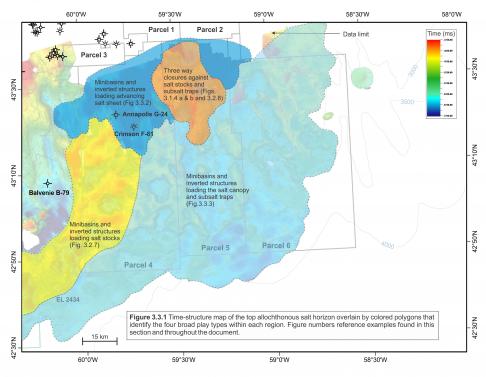
Most traps within Parcels 4-6 are salt related. Figure 3.3.1 is a time-structure map of the Sable Slope Canopy with four colored polygons representing broad regions containing the following play types:
1. Minibasins and inverted structures loading the advancing salt sheet
2. Three way closures against salt stocks and subsalt traps
3. Minibasins and inverted structures loading salt stocks
4. Minibasins and inverted structures loading the salt canopy and subsalt traps.
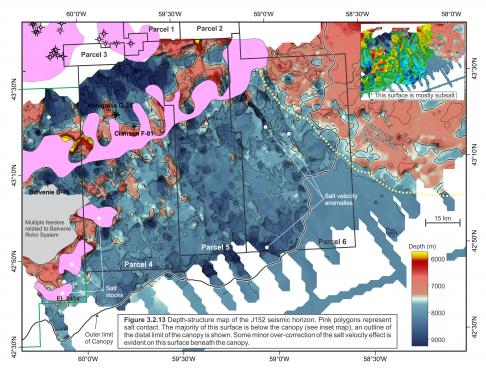
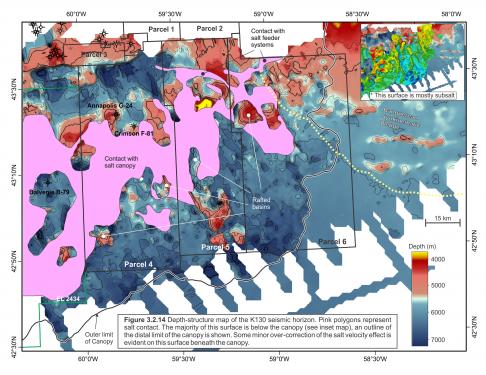
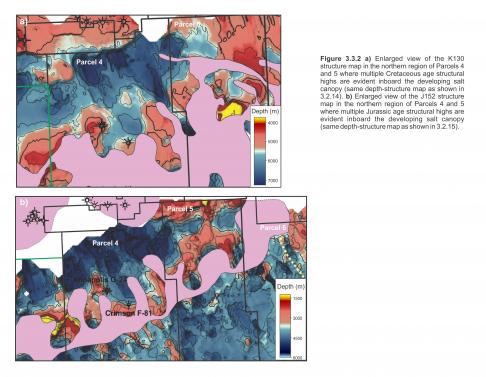
Figures 3.3.2 a) and b) are enlarged versions of the depth-structure maps shown in Figures 3.2.13 and 3.2.14. These images are focused on the region landward of the canopy to illustrate the trend of structural highs that developed here throughout the Jurassic and Cretaceous. Two of these highs are where the Annapolis and Crimson wells were drilled.
There are multiple three way closures against salt structures within the northern half of Parcel 5 (Figure 3.3.1). One particular closure, named Belleisle, consists of inverted Lower Missisauga strata. This structure, due east of the Annapolis and Crimson wells, is closed against salt and contains a thick Lower Missisauga section (Figure 3.1.4 b).
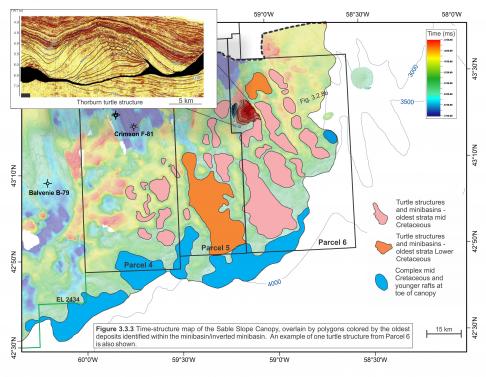
Aside from turtle structures located inboard the salt canopy, two other groups of turtle structures can be identified, those that load salt stocks (yellow polygon) and others that load the canopy (light blue polygon) (Figure 3.3.1). These are differentiated because they are located in two distinct locations. Salt stock loading basins/turtles are mostly present only within a narrow band extending through Parcel 4. Canopy loading basins/turtles are present in all three parcels, and an example of one of the larger turtle structures, Thorburn, is shown in (Figure 3.3.3).
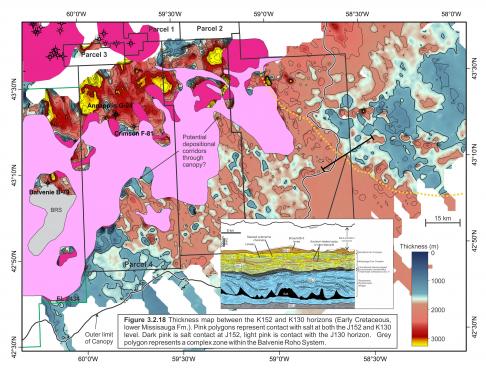
Subsalt plays beneath the canopy are possible throughout Parcels 4-6. The thickness map shown in Figure 3.2.18 illustrates that thick deposits of Early Cretaceous age Lower Missisauga equivalents are located throughout the parcels. This is the sequence identified by Deptuck et al. (2014) as the Missisauga Fan Complex.
Potential Maturity of Cretaceous Source Rocks
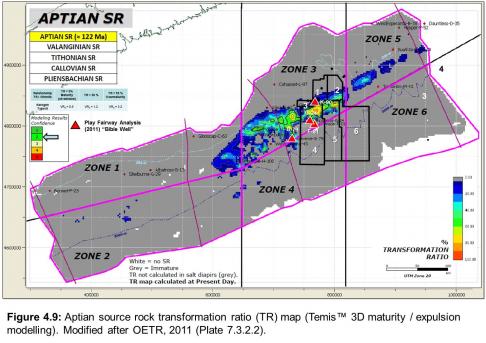
As noted in the Source Rocks discussion (Section 4), the Naskapi Member has fair regional source rock potential with potential improvement in the deep water successions (e.g. Annapolis G-24: TOC~3%, HI=400). Figure 4.9 shows that this interval is mature within a southwest-northeast trending band that passes through the northern parts of the deepwater Call for Bids parcels. This trend of mature Aptian deposits is likely a result of increased burial depths due to an overlying Albian to Cenomanian sequence of clinoforms (see Figures 24 and 25 from Deptuck et al, 2014).
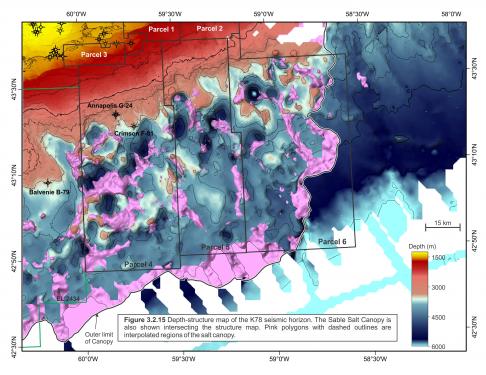
A second scenario to increase the maturity of younger high TOC intervals may also exist. Anomalously deep Early/Late Cretaceous salt withdrawal minibasins are present throughout the parcels (Figure 3.2.15). Naskapi member shales are present within some of these minibasins, and are also likely mature in these locations. This may extend the zone of maturity depicted in Figure 4.9 further to the south.
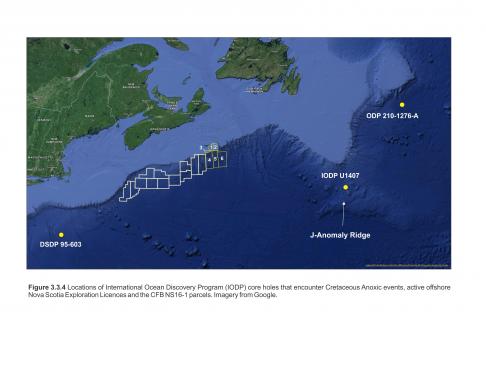
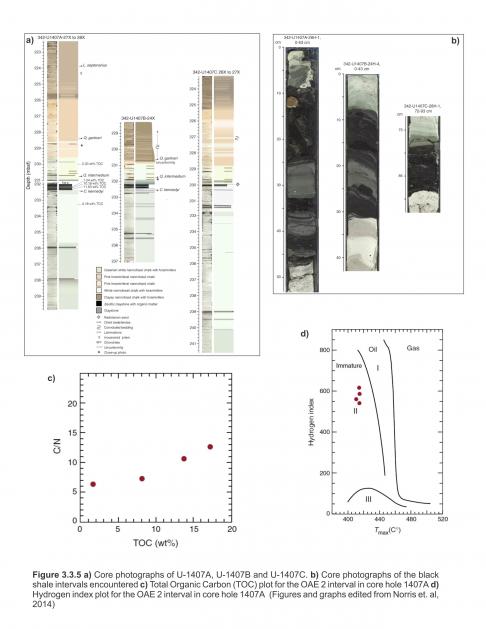
Recent Atlantic IODP expeditions have encountered younger potential source intervals that may be present within these minibasins. In 2012 an IODP drilling program on the J-Anomaly Ridge east of the Scotian basin was targeting Paleogene Newfoundland Sediment Drifts (Figure 3.3.4). At site 1407, holes U1407A, U1407B, and 1407C all intersected an organic black shale interval that is interpreted to represent sedimentation during the Cenomanian-Turonian Oceanic Anoxic Event (OAE) 2 (Norris et al., 2014) (Figure 3.3.5). The black shale deposit related to this anoxic event has a maximum thickness across the three intersections of 44cm and TOC values that reach 11.6% (Norris et al., 2014). This is not the first North Atlantic intersection of the OAE 2 interval; Site 1276 within ODP leg 210 offshore Newfoundland also identified the OAE 2 interval, as well as site 603 of DSDP project 93 (Herbin et al., 1987). The TOC values reach 11.7% at site 1276 and 12.7% at site 603. (Arnaboldi and Meyers, 2006; van Bentum, 2012).
Recent studies of the Aptian Naskapi Member in cores offshore Nova Scotia have also identified what appears to be higher TOC shales related to the Selli Event (OAE 1a)(Chavez et al, 2016). The number of encounters of Cretaceous aged anoxic events in the North Atlantic has been increasing.
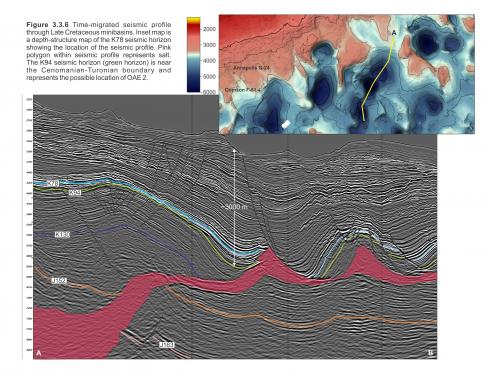
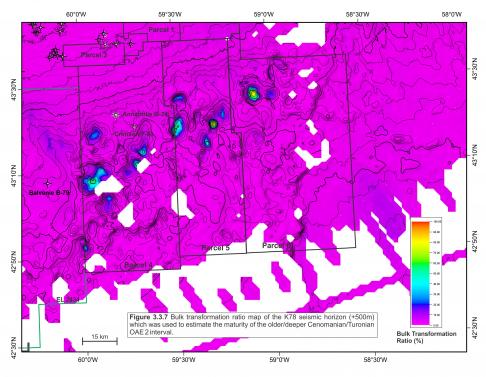
While these anoxic events have very high TOC values, the intervals are thin with very low thermal maturities. The Cenomanian/Turonian boundary lies near the base of the salt withdrawal minibasins where burial depths approach 4000 m and the thickness of the OAE 2 deposits are potentially greater (Figure 3.3.6). On the assumption that the OAE 2 is present within these minibasins, a preliminary run of this scenario using Petrel’s “Quick Look- Maturation” program was completed. This simple model used a basic heat flow gradient of 30°C/km (temperature gradient based on analysis of present day bottom hole temperatures from the Annapolis and Crimson wells) but did not account for any localised enhanced heating effects of nearby salt bodies. Most importantly, the K78 seismic horizon (a younger, shallower seismic horizon) was used as a proxy to represent the Cenomanian/Turonian seismic event. This K78 surface was bulk-shifted to be 500m deeper and more accurately represent the burial depths of the OAE 2 event (Figure 3.3.6).
The results of this simple model show the base of the minibasins have transformation ratios approaching 80% (Figure 3.3.7). The transformation ratios in Figure 3.3.7 are expected to be higher when more precise inputs for burial history and heat flow are used. Nevertheless, this model demonstrates that if this OAE 2 event is indeed present within the basal deposits of these minibasins, it may be reaching maturity. It is not considered to be a significant source rock in this region as the volumes generated from these localised areas would be relatively small; but scenarios accounting for a mature Turonian/Cenomanian (OAE 2) interval should be studied further.


