


A velocity model was built to depth convert mapped seismic markers to produce isopachs and to correct a number of artifacts that impede accurate seismic interpretation and assessment of structure maps in the study area. The heavily incised post-Pleistocene seafloor (particularly along the upper slope; see Figure 3.2.10) and highly variable water depths create velocity artifacts within time-migrated seismic datasets. Likewise, mapped Cretaceous and Jurassic seismic markers commonly underlie the Sable Slope Canopy, with abrupt changes in salt thickness associated with canopy loading. Velocity “pull up” effects on horizons beneath thicker remnants of canopy salt are particularly problematic. The velocity model generated for this study has helped correct many of these artifacts, increasing interpretation confidence, though several artifacts still remain. Balvenie B-79, Annapolis G-24 and Crimson F-81 were used to generate the time-depth relationships for the model. These wells provide time-depth curves for the Cretaceous and shallower intervals (deepest penetration is to the top Valanginian at Annapolis) with constant velocities used for the Jurassic section below well penetrations. Based on analysis of salt penetrations on the Scotian Margin by Shimeld (2004), a salt velocity of 4400 m/sec was also used.
The J200 seismic marker, as described earlier, is difficult to interpret north of the ECMA where it deepens beneath the autochthonous salt basin; as such there is a zone with no data in the northern part of Parcels 4 and 5 (Figure 3.2.1). The mid-Jurassic J163 (Callovian) depth-structure map indicates the Lower to Middle Jurassic section is generally between 9 and 10 km below sea level across most of the study area, shallowing slightly in Parcel 4 (Figure 3.2.12). Multiple salt contacts define the location of mid Jurassic feeders in the northern parts of the parcels, when salt was still within the autochthonous salt basin north of the ECMA.
The Late Jurassic J152 (Tithonian) depth-structure map has numerous structural highs along the northern half of the parcels and also northeast of Parcel 6 where the J152 marker drapes over detached Jurassic strata and inverted successions within the BSW (Figure 3.2.13). The structural highs passing through Annapolis and Crimson are related to salt withdrawal/loading (and subsequent inversion) of the advancing salt front, as the Mic Mac Formation prograded across the shelf and slope. Any potential closures on this map are below the base of the wells drilled in this region. As shown by the salt contacts, a widespread NE trending salt wall extending roughly 100 km was expelled along the seaward margin of the primary salt basin in the Late Jurassic.
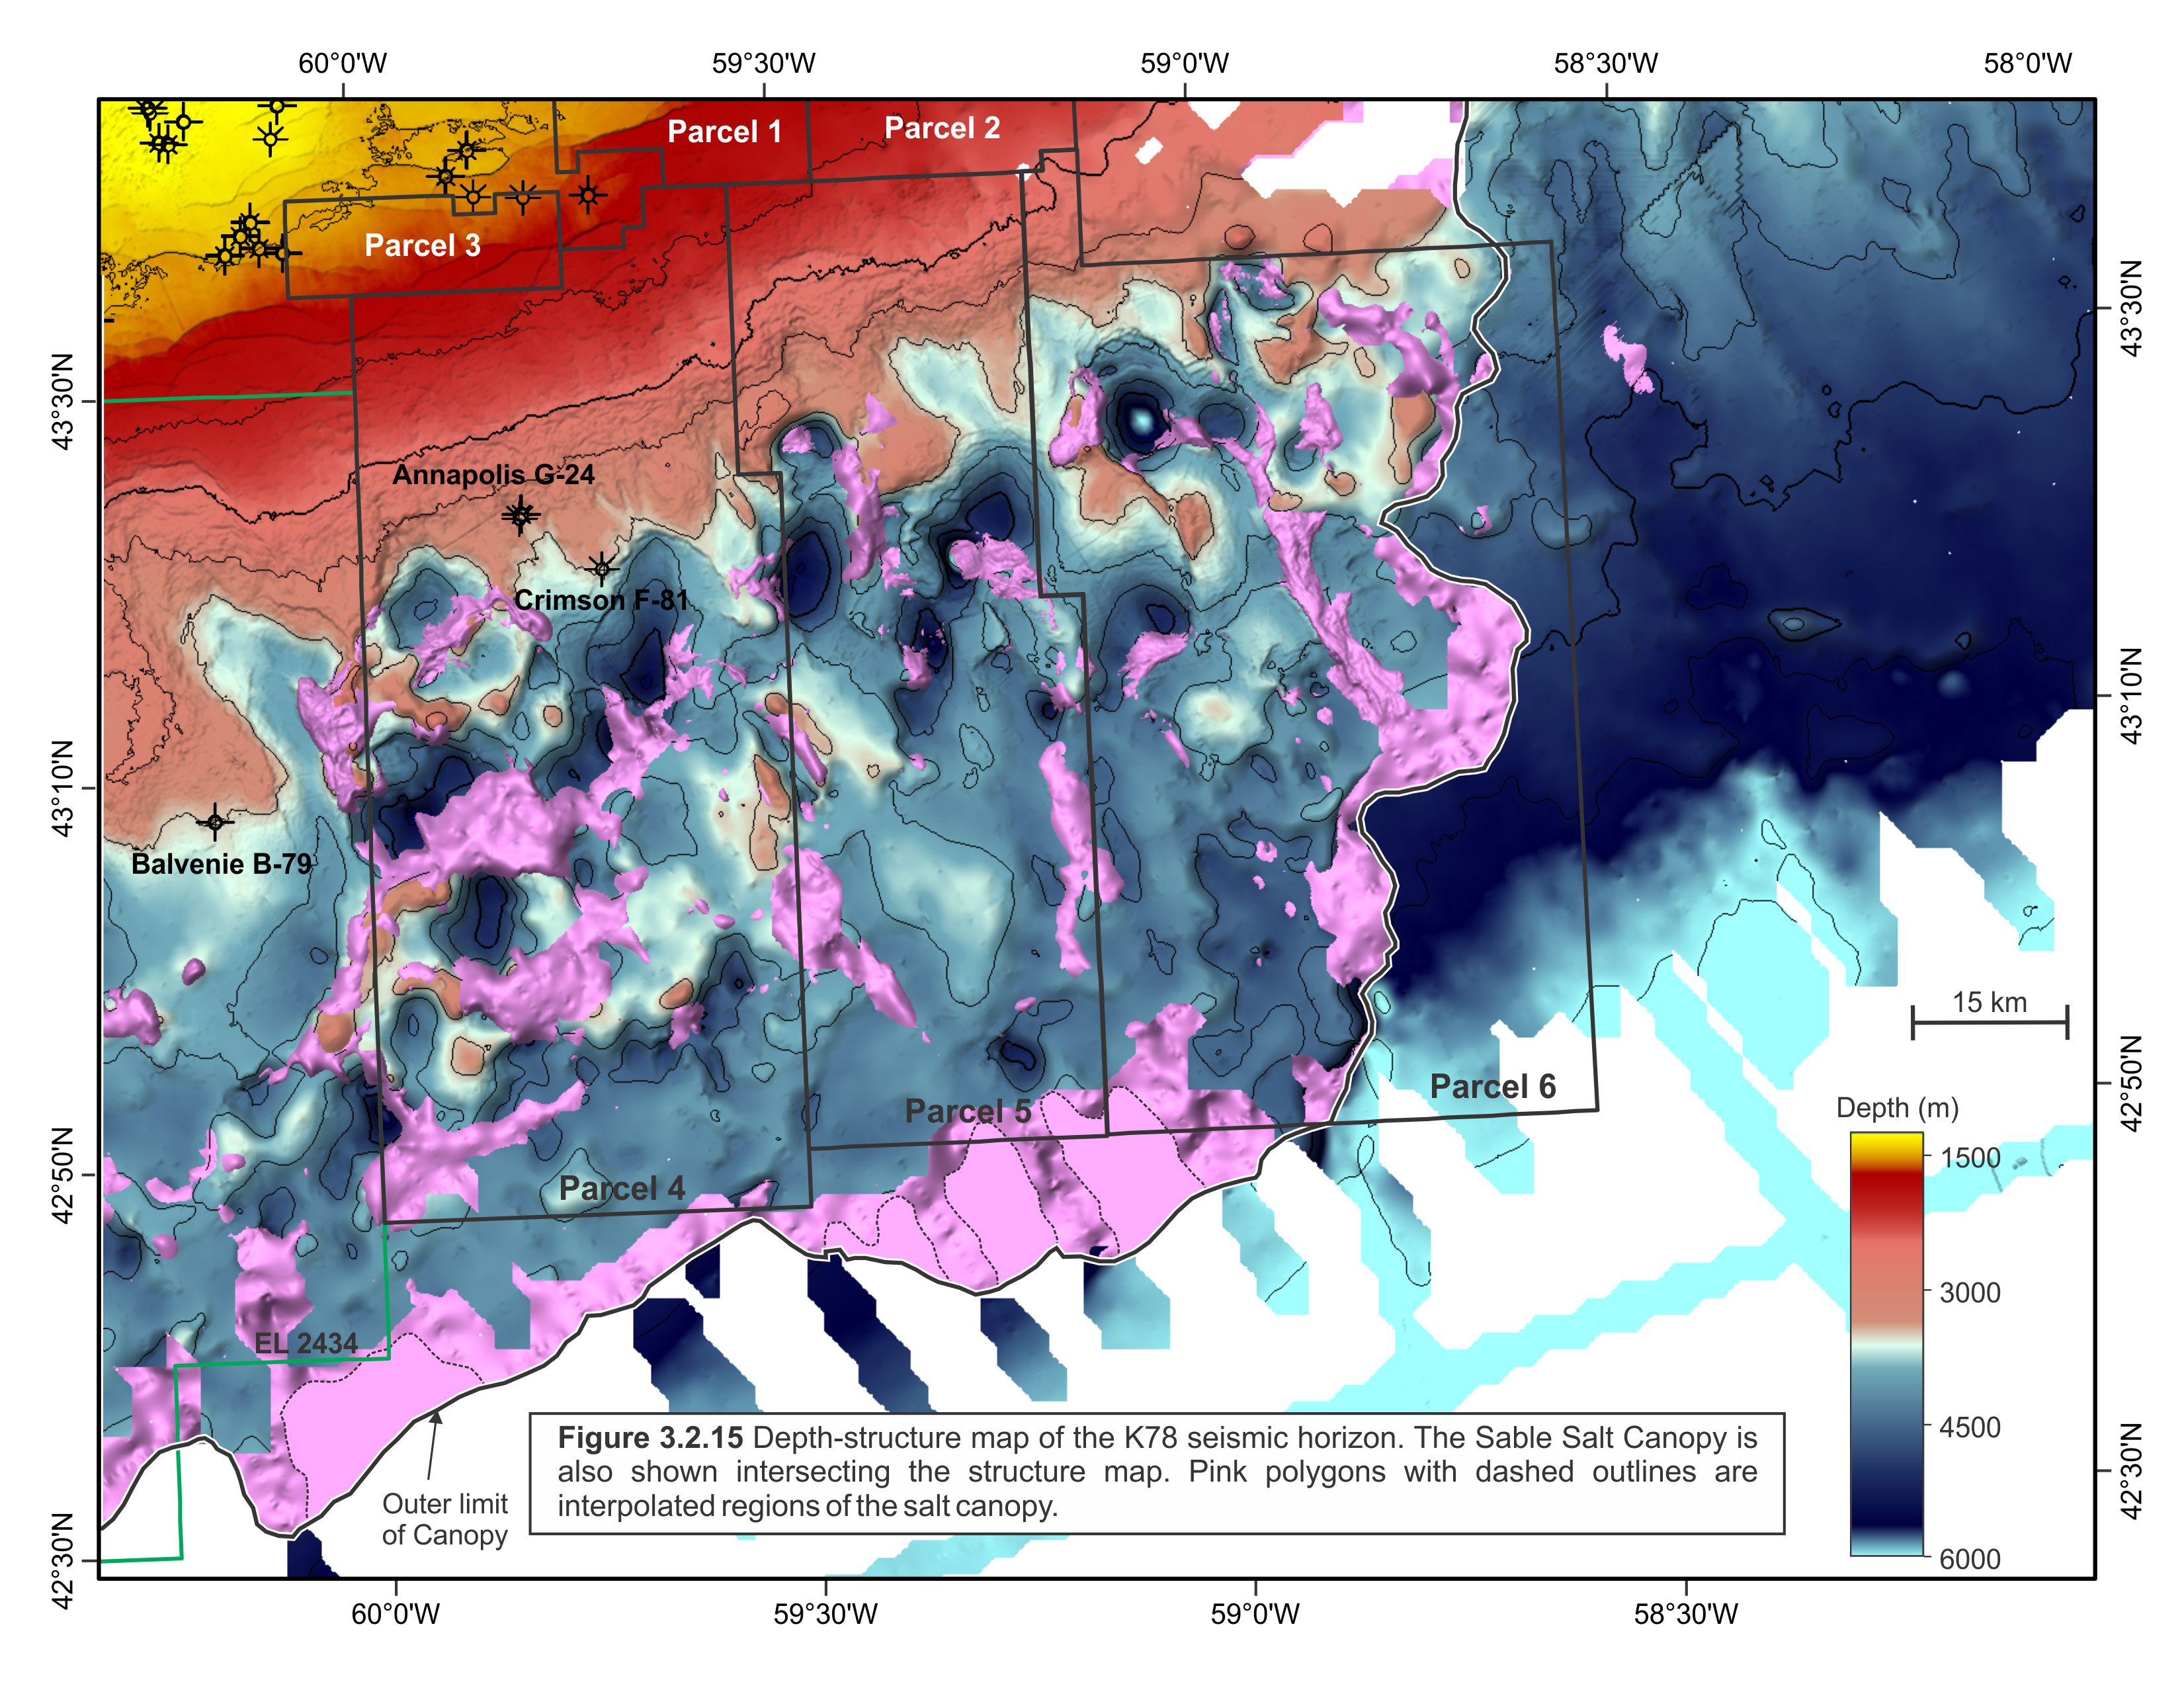
Widespread salt canopies began to form in the Early Cretaceous. Salt tongues and amalgamated tongues migrated up and out of the primary salt basin in numerous areas, climbing across the Early Cretaceous underpinned by oceanic crust (Figure 3.2.14). Similar to the J152 map, a trend of structural highs landward of the advancing salt is evident on the K130 (Hauterivian) depth structure map, and two of these structures were tested by the Annapolis and Crimson wells. There are multiple locations above the canopy where high-displacement extensional corridors are noted. Basins and turtle structures within these corridors are rafted downslope towards the SSE and are shown in Figure 3.2.14. The Sable Slope Canopy was fully formed by the Late Cretaceous (Figure 3.2.15), when it reached its maximum downslope extent, with salt displaced up to 85 km from the seaward edge of the primary salt basin. Numerous deep proximal basins (in the northern half of Parcels 4-6) formed at this time as the landward parts of the salt canopy were reactivated. Some of these basins are more than 5km deep. The locations of these basins coincide with the continent-ocean crustal boundary (i.e. the ECMA) and are the result of loading the east-west trend of early salt feeders along the southern edge of the autochthonous salt basin.
Isopach maps
Total postrift thickness within Parcels 4-6 is greater than 14km (Figure 3.2.11). The Early (Pleinsbachian) to Middle (Bajocian) Jurassic Mohican Formation defines the initial postrift fill in the Scotian Basin and consists of texturally immature fluvial to shallow marine sandstones, siltstones, and red-brown and green shales (Given, 1977) with the thickness of its deep water equivalent shown in Figure 3.2.16. The SSW-NNE trend of sediment thicks represents infilling of the troughs between rotated basement blocks (see Figure 3.2.1). This J200-J163 succession also thickens in the northern edge of the parcels where it probably first began to load the salt basins in this area.
Deposition of the Mohican Formation or its equivalents in the Middle Jurassic was followed by an influx of siliciclastics of the Mic Mac and coeveal carbonates of the Abenaki formations (Wade and Maclean, 1990). An expanded section of these Late Jurassic sediments is present northeast of Parcel 6 within the BSW (Figure 3.2.17). It extends into the deep water portions of Parcels 5 and 6 but tapers to less than 1 km within Parcel 4. Inboard of the salt, multiple depositional corridors developed where a focusing of Late Jurassic deposits occurred and is particularly notable near the Annapolis and Crimson wells. The thickness map defines an undrilled interval, and while its facies are unknown they are expected to be deep water equivalents to the Mic Mac and Abenaki (i.e. siliciclastics and re-worked carbonate sediments deposited as calciclastic fan complexes?)
The Missisauga Formation was deposited in the Early Cretaceous (Berriasian to Barremian). This sand-rich sequence of fluvial, deltaic and shallow marine clastic sediments is divided into Upper and Lower members separated by an interval of generally thin Hauterivian/Barremian oolitic limestones known as the “O” Marker (K130). The thickness map in Figure 3.2.18 illustrates the thickness of the Lower Member with accumulations greater than 3km found landward of the developing canopy. These expanded sections are a result of downbuilding into the salt basin and ponding of turbidite deposits along the upper slope. This interval was penetrated by the Annapolis and Crimson wells and in the former confirmed the presence of gas-charged, reservoir quality turbidite sandstones. A prominent thin is noted above the BSW. Although some turbidite fan systems may have avoided the bathymetric high created by this detachment system, the southwestward shift in sedimentation is believed to more strongly reflect a shift in the Lower Cretaceous delta systems on the shelf, perhaps in response to the Avalon Uplift (see Deptuck et al., 2014). In deep water, this sequence contains numerous stacked submarine channel belts referred to as the Missisauga Fan Complex. Fan deposits buttressed the southwestern parts of the BSW, and the succession can be correlated further west still where it underlies the Sable Slope Canopy. Potential sediment entry points are also recognized above the canopy in Parcels 4 and 5, along future sutures between different salt sheets.
The Upper Missisauga and Logan Canyon formations are represented by the K130 (Hauterivian/Barremian) to K78 (Campanian) thickness map (Figure 3.2.19). The map includes the salt canopy, so its southern parts have anomalous thicks and thins that are not representative of the true thickness of the stratigraphy. The northern edge however is absent of salt and therefore the east-west trending thick represents the true thickness of the Upper Missisauga and Logan Canyon formations. On the upper slope this sequence exceeds 4km in thicknesses, most of which is due to a deltaic package that progrades onto the upper slope within the Aptian-Albian.