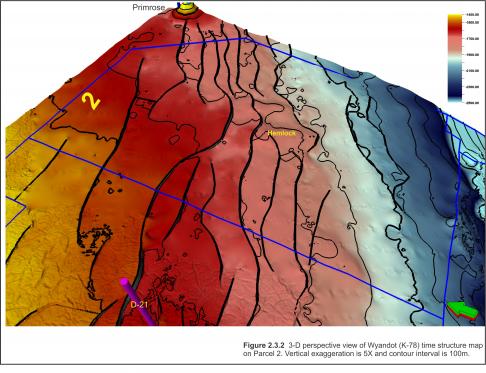
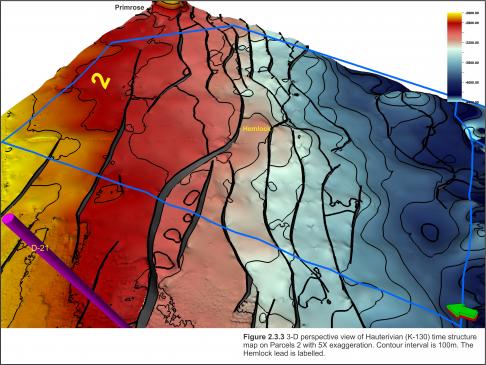
Structural closures are evident on the Wyandot time structure map even with the 100 ms contour interval (Figure 2.3.2). The Hauterivian 3D time surface also shows closures produced by rollovers against the faults with the large Hemlock prospect extending over three fault blocks (Figure 2.3.3). This map also has 100 ms contour intervals so only large trends are evident. Many of these rollover structures, including Hemlock, are accentuated by salt tectonics. Another lead could exist where Lower Missisauga sands are trapped under the overhanging salt.
These structures are on trend with the North Triumph producing gas field and the Glenelg and Chebucto Significant Discoveries. Integration of additional existing 2-D data or acquisition of a new 3D seismic survey would be required to properly image these traps. A closure in the southeast corner of Parcel 2 is created by drape over the Alma Ridge but is difficult to image on the available 2D seismic. Better imaging of this ridge is required to adequately evaluate this area’s potential.


