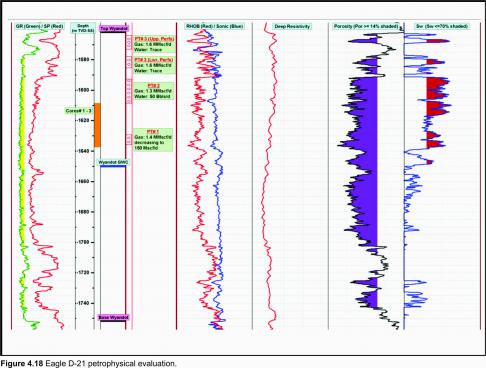
A detailed petrophysical assessment was conducted on Eagle D-21. A few minor scattered gas shows were encountered in the Missisauga Formation from 4100 m to 4660 m (TD); however none of these sands are interpreted to contain significant hydrocarbon accumulations. The main reservoir in Eagle is the Wyandot Formation which has a gross thickness of 190 m at the D-21 well and consists of interbedded limestones, marls and chalks. The Wyandot reservoir is normally pressured but slight overpressuring was detected near the base of the well in the Missisauga Formation.
A complete suite of primary logging measurements were acquired over most of the well, including the Wyandot Formation (Figure 4.18) and 3 continuous conventional cores were cut in the Wyandot reservoir interval (Table 4.6).
|
Core# |
Interval (m MD) |
Recovery |
|---|---|---|
|
1 |
1638.6 – 1649.0 m |
9.4 m |
|
2 |
1649.0 – 1658.4 m |
8.8 m |
|
3 |
1658.4 – 1667.6 m |
8.7 m |
Table 4.6 Eagle conventional core intervals.
Routine core analysis indicated porosities ranging from 19 to 36% with an average of 28%, while permeabilities range from 0.2 to 50 mD with an average of 0.6 mD. Core plugs containing fractures typically had the highest permeability. Core permeabilities are generally <2.0 mD, however all plugs had measured permeabilities above the 0.1 mD reservoir cutoff typically used for gas reservoirs.
Three production tests were conducted in the Wyandot Formation (Figure 4.18) with each zone being acidized prior to testing to improve deliverability (Table 4.7). PT#2 consisted of a 9.5 hours flow period and 12 hours shut-in time. Analysis of the transient data from this test suggests a low permeability zone consistent with core permeability, initial reservoir pressure of 2350 psi, and very low total skin value.
The reservoir properties obtained from this test were used to generate models to assess gas recovery from different well configurations. It was concluded that recovery from a multi-staged horizontal well could be significantly higher than a vertical well (15 – 20 times) and capable of delivering gas at substantially higher rates. This multi-staged horizontal well model also suggests that the production rate drops rapidly during the first few years of production but the decline rate decreases to low values after this initial production period. This production profile enables production rate to be sustained at lower values for a longer period of time.
|
Production Test# |
Top |
Base |
Gas Rate |
Condensate Rate (M3/d) |
Condensate Rate (Bbls/d) |
Water Rate (M3/d) |
Water Rate (Bbls/d) |
|---|---|---|---|---|---|---|---|
|
1 |
1659.6 |
1666.0 |
1600.6 |
0 |
0 |
Trace |
Trace |
|
2 |
1622.8 |
1638.6 |
1300.3 |
0 |
0 |
8* |
50* |
|
3 |
1594.1 |
1603.2 |
1400.4 |
0 |
0 |
0 |
0 |
|
3 |
1608.1 |
1615.4 |
* The salinity of the recovered water in PT# 2 was 16,000 ppm while the salinity of the formation water is estimated to be 85,000 ppm, which suggests the produced water is likely mud filtrate.
** In PT# 3 the upper and lower perforations were tested together.
Table 4.7 Eagle D-21 production tests.
A petrophysical assessment of the Eagle D-21 well was conducted using all available log, core and test data (Table 4.8). A log defined gas-water contact (GWC) was interpreted at 1680.3 m MD / -1650.1 m TVD-SS. Due to the limited matrix permeability of the Wyandot a considerable transition zone, caused by capillary pressure effects, is evident on logs. This transition zones extends approximately 30 m above the GWC.
|
Zone |
Top |
Base |
Net Pay |
Net Pay Por. (%) |
Net Pay Perm. (mD) |
Sw (%) |
|---|---|---|---|---|---|---|
|
Wyandot |
1592.3 |
1782.2 |
52 |
27 |
0.50 |
54 |
Table 4.8 Eagle D-21 petrophysical assessment.


