

Western Scotian Margin
- Introduction and scope
- First-order Structural Subdivisions
- :: LaHave Platform Province
- :: Slope Detachment Province
- :: Allochthonous Salt and Minibasin Province
- :: Outer ECMA Province
- Discussion and Summary
- Figures
NS11-1 Parcel Prospectivity
Location and Coordinates
Geoscience References

Western Scotian Margin
Figures
If you are having trouble downloading files on this website, please right click the link and choose “Save target As"
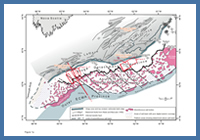
Figure 1a
Map showing key structural elements and four-way post-rift structural subdivision described for the western Scotian Margin in this study. Fault traces on the LaHave Platform are from Wade and MacLean (1990). Note that parts of the autochthonous salt basin underlie the LaHave Platform, Slope Detachment, and Allochthonous Salt and Minibasin provinces. Note also that some parts of the autochthonous salt basin have poor data coverage and hence its margins in these locations are poorly constrained. See text for details.
Map showing key structural elements and four-way post-rift structural subdivision described for the western Scotian Margin in this study. Fault traces on the LaHave Platform are from Wade and MacLean (1990). Note that parts of the autochthonous salt basin underlie the LaHave Platform, Slope Detachment, and Allochthonous Salt and Minibasin provinces. Note also that some parts of the autochthonous salt basin have poor data coverage and hence its margins in these locations are poorly constrained. See text for details.
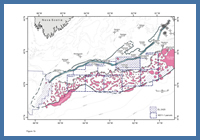
Figure 1b
Map showing location of NS11-1 nominated parcels. Limits of autochthonous salt basin and boundaries between structural provinces are the same as in Figure 1a.
Map showing location of NS11-1 nominated parcels. Limits of autochthonous salt basin and boundaries between structural provinces are the same as in Figure 1a.
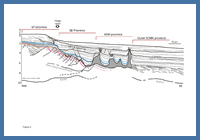
Figure 2
Line drawing of a composite seismic profile extending from the LaHave Platform (LP), across the Slope Detachment (SD) and Allochthonous Salt and Minibasin (ASM) provinces, and terminating in the Outer ECMA province where Seaward Dipping Reflections (SDRs) are recognized. Water column was depth converted, but remaining section is in two-way travel time. See Figure 1a for location.
Line drawing of a composite seismic profile extending from the LaHave Platform (LP), across the Slope Detachment (SD) and Allochthonous Salt and Minibasin (ASM) provinces, and terminating in the Outer ECMA province where Seaward Dipping Reflections (SDRs) are recognized. Water column was depth converted, but remaining section is in two-way travel time. See Figure 1a for location.
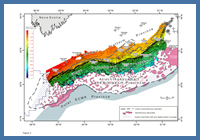
Figure 3
Gridded time-structure map on the top of the Jurassic carbonate bank.
Gridded time-structure map on the top of the Jurassic carbonate bank.
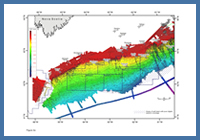
Figure 4a
Gridded time-structure map of the sea floor marker, showing parcel locations.
Gridded time-structure map of the sea floor marker, showing parcel locations.
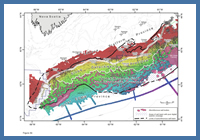
Figure 4b
Gridded time-structure map of the sea floor marker, overlain by key structural provinces described in this study.
Gridded time-structure map of the sea floor marker, overlain by key structural provinces described in this study.
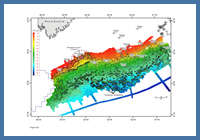
Figure 5a
Gridded time-structure map on a prominent Early Eocene unconformity that formed, at least in part, in response to a 50.8 Ma bollide impact. Scarps and canyon heads within the impact crater are highlighted.
Gridded time-structure map on a prominent Early Eocene unconformity that formed, at least in part, in response to a 50.8 Ma bollide impact. Scarps and canyon heads within the impact crater are highlighted.
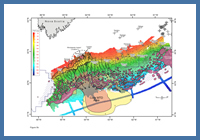
Figure 5b
Gridded time-structure map of the Early Eocene unconformity, annotated to show canyons that transported failed material directly down-slope from the impact site, where a widespread mass transport deposit is recognized. Orange indicates the primary core of the mass transport deposit, while yellow indicates peripheral mass wasted material. There is a high degree of uncertainty about its distribution in deepwater.
Gridded time-structure map of the Early Eocene unconformity, annotated to show canyons that transported failed material directly down-slope from the impact site, where a widespread mass transport deposit is recognized. Orange indicates the primary core of the mass transport deposit, while yellow indicates peripheral mass wasted material. There is a high degree of uncertainty about its distribution in deepwater.
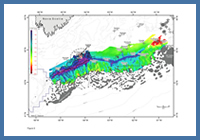
Figure 6
Time-thickness map between the top Jurassic carbonate bank marker and the Early Eocene unconformity, showing the widespread erosion of the Cretaceous to Paleocene stratigraphic succession caused, at least in part, by the bolide impact.
Time-thickness map between the top Jurassic carbonate bank marker and the Early Eocene unconformity, showing the widespread erosion of the Cretaceous to Paleocene stratigraphic succession caused, at least in part, by the bolide impact.
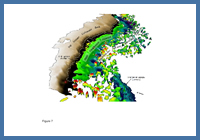
Figure 7
Perspective view from the southwest showing the relationship between the Jurassic carbonate bank, slope detachment province, and the allochthonous salt and minibasin province. This image illustrates the striking absence of allochthonous salt diapirs in the slope detachment province.
Perspective view from the southwest showing the relationship between the Jurassic carbonate bank, slope detachment province, and the allochthonous salt and minibasin province. This image illustrates the striking absence of allochthonous salt diapirs in the slope detachment province.
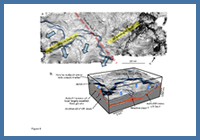
Figure 8
a) Planform view of a mid-Jurassic seismic marker (dip map) showing headscarps of detached slabs (blue) of Jurassic strata in the Slope Detachment Province. Two northeast trending rift blocks define structural highs in the 3D seismic survey that may be offset by a transfer fault; b) Perspective view showing low angle listric faults that detach in the autochthonous salt layer. Note the preferential expulsion of salt along rift block. Blue arrows indicate detachment direction. See Figure 1a for location.
a) Planform view of a mid-Jurassic seismic marker (dip map) showing headscarps of detached slabs (blue) of Jurassic strata in the Slope Detachment Province. Two northeast trending rift blocks define structural highs in the 3D seismic survey that may be offset by a transfer fault; b) Perspective view showing low angle listric faults that detach in the autochthonous salt layer. Note the preferential expulsion of salt along rift block. Blue arrows indicate detachment direction. See Figure 1a for location.
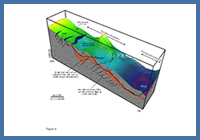
Figure 9
Perspective view of a mid-Jurassic seismic marker showing thin-skinned detachment and extension above a variably thick autochthonous salt layer, and resulting down-slope contraction that produces a thrust. Basement below the salt is heavily faulted. See Figure 1a for location.
Perspective view of a mid-Jurassic seismic marker showing thin-skinned detachment and extension above a variably thick autochthonous salt layer, and resulting down-slope contraction that produces a thrust. Basement below the salt is heavily faulted. See Figure 1a for location.
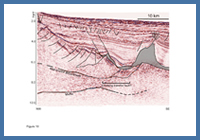
Figure 10
Close-up seismic profile of middle parts of Figure 2 (SD to proximal ASM province), showing prominent northwest-dipping faults that may detach in a mid-crustal detachment surface. Slow water column velocities were depth converted, but remaining section is in TWT.
Close-up seismic profile of middle parts of Figure 2 (SD to proximal ASM province), showing prominent northwest-dipping faults that may detach in a mid-crustal detachment surface. Slow water column velocities were depth converted, but remaining section is in TWT.
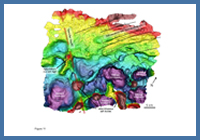
Figure 11
Close-up of the top autochthonous salt to primary weld marker, showing the synrift 'fabric' produced by underlying rift blocks, with offsets on minibasins interpreted to be caused by a transfer fault. The figure also illustrates the transition from the SD province to the ASM province where allochthonous salt bodies were expelled from a chain of minibasins along the base of the image. Shallow areas are red, deep areas are purple. See Figure 1a for location.
Close-up of the top autochthonous salt to primary weld marker, showing the synrift 'fabric' produced by underlying rift blocks, with offsets on minibasins interpreted to be caused by a transfer fault. The figure also illustrates the transition from the SD province to the ASM province where allochthonous salt bodies were expelled from a chain of minibasins along the base of the image. Shallow areas are red, deep areas are purple. See Figure 1a for location.
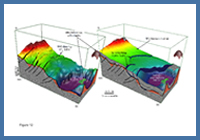
Figure 12
a) Perspective view sculpted along the top autochthonous salt to primary weld marker, showing the synrift fabric below a thin veneer of autochthonous salt. The landward-dipping (northwest) extensional basement faults are well imaged; b) Perspective view showing a series of seaward dipping listric faults within Jurassic cover strata that sole out into the thin autochthonous salt layer. Fault vergence is in the opposite direction of the northwest-dipping synrift faults. See Figure 1a for location.
a) Perspective view sculpted along the top autochthonous salt to primary weld marker, showing the synrift fabric below a thin veneer of autochthonous salt. The landward-dipping (northwest) extensional basement faults are well imaged; b) Perspective view showing a series of seaward dipping listric faults within Jurassic cover strata that sole out into the thin autochthonous salt layer. Fault vergence is in the opposite direction of the northwest-dipping synrift faults. See Figure 1a for location.
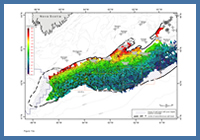
Figure 13a
Gridded time-structure map on the top autochthonous salt surface, correlated along the equivalent primary weld.
Gridded time-structure map on the top autochthonous salt surface, correlated along the equivalent primary weld.
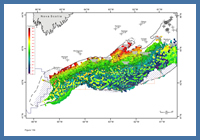
Figure 13b
Gridded time-structure map on the top autochthonous salt surface, overlain by the gridded surface from the top allochthonous salt bodies located predominantly in the ASM province. Autochthonous salt highs produce a polygonal network of minibasins in the ASM province, many of which form the stocks of overlying allochthonous salt bodies.
Gridded time-structure map on the top autochthonous salt surface, overlain by the gridded surface from the top allochthonous salt bodies located predominantly in the ASM province. Autochthonous salt highs produce a polygonal network of minibasins in the ASM province, many of which form the stocks of overlying allochthonous salt bodies.
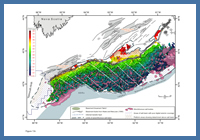
Figure 13c
Annotated map of the top autochthonous salt gridded surface, showing location and orientation of basement lineaments and the interpreted location of transfer faults that appear to offset the landward margin of the ASM province.
Annotated map of the top autochthonous salt gridded surface, showing location and orientation of basement lineaments and the interpreted location of transfer faults that appear to offset the landward margin of the ASM province.
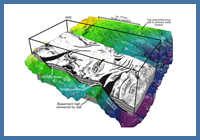
Figure 14
Rafted blocks detaching above high-relief basement veneered with autochthonous salt.
Rafted blocks detaching above high-relief basement veneered with autochthonous salt.
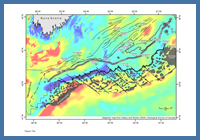
Figure 15a
Magnetic map of western Scotian Margin (from Oakey and Dehler, 2004), overlain by the interpreted transfer faults, allochthonous salt bodies and rift faults and graben complexes from Wade and MacLean (1990).
Magnetic map of western Scotian Margin (from Oakey and Dehler, 2004), overlain by the interpreted transfer faults, allochthonous salt bodies and rift faults and graben complexes from Wade and MacLean (1990).
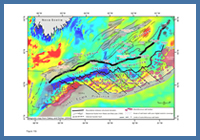
Figure 15b
Magnetic map of the western Scotian Margin (from Oakey and Dehler, 2004), overlain by key structural elements and the four postrift structural provinces described in this study. Note that much of the ASM province overlies the inner part of the ECMA, whereas the outer band of the ECMA lies outside the interpreted seaward boundary of the autochthonous salt basin.
Magnetic map of the western Scotian Margin (from Oakey and Dehler, 2004), overlain by key structural elements and the four postrift structural provinces described in this study. Note that much of the ASM province overlies the inner part of the ECMA, whereas the outer band of the ECMA lies outside the interpreted seaward boundary of the autochthonous salt basin.
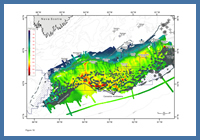
Figure 16
Time-thickness map between the Early Eocene unconformity and the seafloor (approximately a Cenozoic thickness map, minus the Paleocene). Map shows a clear area of Cenozoic minibasins near the centre of the map.
Time-thickness map between the Early Eocene unconformity and the seafloor (approximately a Cenozoic thickness map, minus the Paleocene). Map shows a clear area of Cenozoic minibasins near the centre of the map.
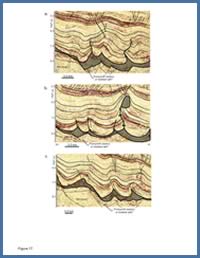
Figure 17
Three seismic profiles across Jurassic to Cretaceous folds in the landward parts of the ASM province in the eastern study area (see Deptuck, 2008).
Three seismic profiles across Jurassic to Cretaceous folds in the landward parts of the ASM province in the eastern study area (see Deptuck, 2008).
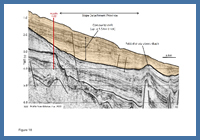
Figure 18
Northwest- to southeast-oriented profile across a thick contourite drift that is thickest above the SD province. Aggradation of this drift may have prompted down-slope squeezing of pre-existing salt diapirs in the ASM province. Profile from Kidston et al., (2005).
Northwest- to southeast-oriented profile across a thick contourite drift that is thickest above the SD province. Aggradation of this drift may have prompted down-slope squeezing of pre-existing salt diapirs in the ASM province. Profile from Kidston et al., (2005).
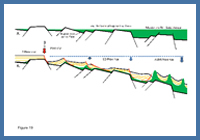
Figure 19
Sketch showing interpreted a) pre-breakup configuration of margin, with thickest synrift salt accumulating in the ASM province where maximum rift subsidence is inferred to have taken place; b) Early postrift configuration with detachment of Jurassic strata in response to hinge zone development and thermal subsidence. SD province was tilted seaward during this time, whereas the ASM province may have subsided more uniformly. Contractional structures in the proximal parts of the ASM province develop in response to up-slope extension due to gravity gliding.
Sketch showing interpreted a) pre-breakup configuration of margin, with thickest synrift salt accumulating in the ASM province where maximum rift subsidence is inferred to have taken place; b) Early postrift configuration with detachment of Jurassic strata in response to hinge zone development and thermal subsidence. SD province was tilted seaward during this time, whereas the ASM province may have subsided more uniformly. Contractional structures in the proximal parts of the ASM province develop in response to up-slope extension due to gravity gliding.